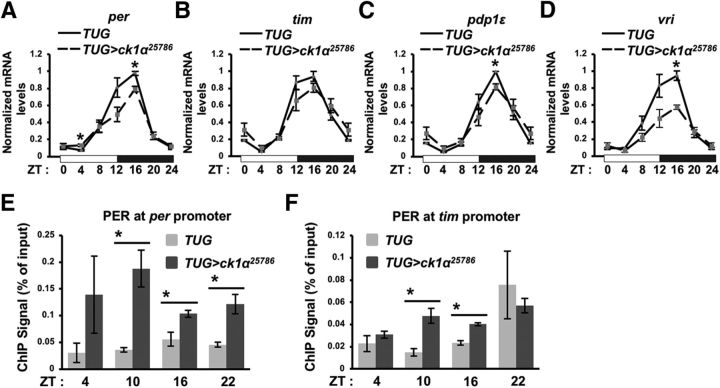
Figure 4.
ck1α knock-down lowers clock gene transcription through increased PER occupancy at clock gene promoters. A–D, Clock gene expression was quantified by real-time PCR and normalized to noncycling cbp20 expression. Values were processed so that the mRNA level at each time point is relative to the maximum value over the time course, which is set at 1. White and black horizontal bars on the x-axis represent lights on and off, respectively. Error bars indicate SEM from three biological triplicates. ZT24 data point was plotted twice as ZT0 and ZT24 to facilitate viewing of daily cycling. Solid and dashed lines represent TUG control and TUG>ck1α RNAi25786 respectively. *p < 0.05. E, F, Chromatin IP analysis of PER occupancy in TUG control and TUG>ck1α RNAi25786. Shown is the amount of ChIP signal on per and tim promoter as measured by qPCR relative to the input at the indicated time points. Error bars indicate SEM from biological replicates (n = 3 for per promoter, n = 2 for tim promoter). *p < 0.05.

