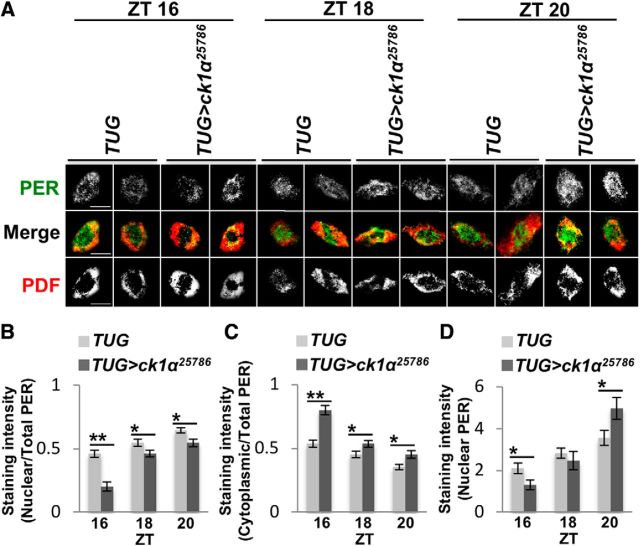
Figure 6.
CK1α promotes nuclear entry of PER. A, Confocal images of brains from adult TUG control and ck1α RNAi25786 flies stained with α-PER Rb s3968-1 (green) and α-PDF (red) in l-LNv clock neurons. Scale bars are shown on the left-most panels only and indicate 10 μm. Flies were entrained for 3 d in LD cycles and collected at the indicated times on LD3 for fixation and immunostaining. Duplicate panels are shown for each condition. B, Bar graph displaying the fraction of PER in the nucleus presented as nuclear PER intensity divided by total intensity of PER. C, Bar graph displaying the fraction of PER in the cytoplasm presented as cytoplasmic PER intensity divided by total intensity of PER. D, Bar graph showing the amount of nuclear PER expressed as pixel intensity (in thousands). Error bars indicate SEM of 15 neurons from 10 brains. *p < 0.05, **p < 0.005.

