Figure 1.
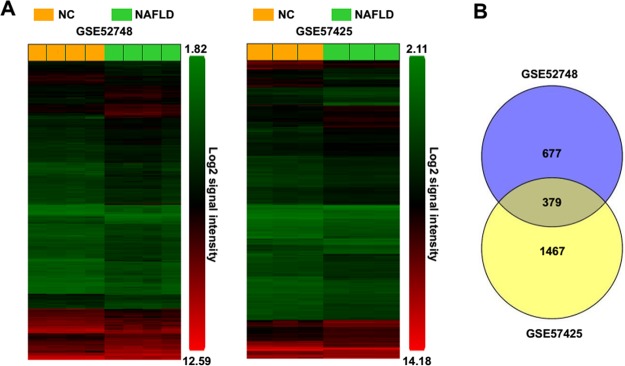
The identification of common key differentially expressed genes (DEGs) from two different microarray data. (A) The DEGs in nonalcoholic fatty liver disease (NAFLD) groups compared to control groups from microarray data GSE52748 and GSE57425. (B) The identified common DEGs between GSE52748 and GSE57425 by Venny 2.0 online tool. NC, control groups; NAFLD, NAFLD groups.

