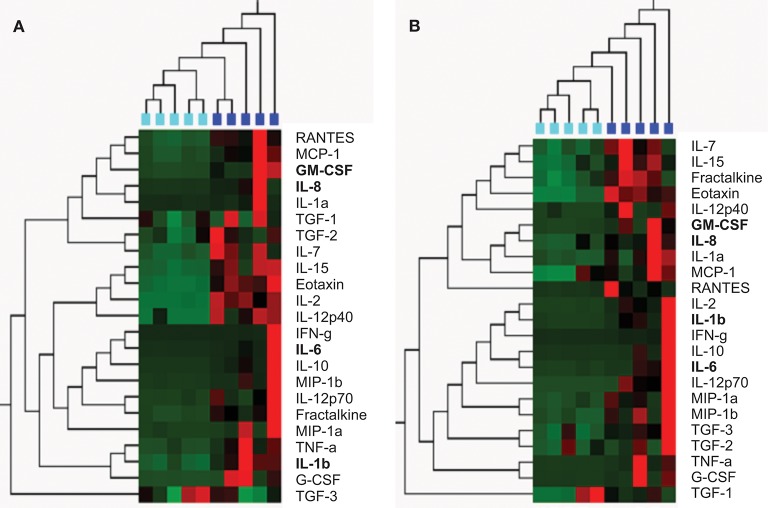
Figure 1.
Unsupervised hierarchical clustering confirmed selection of semen from the HIV-negative (A) and HIV-positive (B) men by cytokine concentration; and to cluster men according to the similarities of their semen cytokine expression profiles (using Qlucore Omics Explorer). (A) HIV-negative men with the lowest concentrations of 23 cyokines (n = 5; turquoise blocks) clustered separately from HIV-negative men with the highest concentrations of these cytokines (n = 5; blue blocks). (B) HIV-positive men with the lowest concentrations of 23 cyokines (n = 5; turquoise blocks) clustered separately from HIV-positive men with the highest concentrations of these cytokines (n = 5; blue blocks). Cytokine concentrations are indicated using a color scale, ranging from green (low) to red (high). The dendrogram above the heat map illustrates degrees of relatedness between cytokine profiles evident within semen from the various men. In this tree, shorter and longer horizontal branch path lengths between pairs of cytokines, respectively reflect greater and lower degrees of similarity between the expression profiles of the assessed cytokines.Cytokines shown in bold indicate those that were measured in the in vitro experiments in this study.

