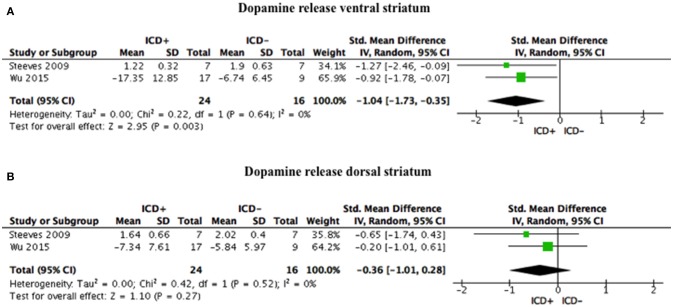
Figure 3.
Forest plots for dopamine release. Here are reported forest plots for dopamine release in the ventral striatum (A), and in dorsal striatum (B). Standardized mean difference represents Hedges's g effect size. The size of the square indicates the weight of the study. The horizontal line represents the 95% confidence interval. The diamond represents the pooled effect size. Negative effect sizes indicate lower dopamine release in PD patients with ICD (ICD+) in comparison to those without ICD (ICD–). ICD, impulse control disorder; PD, Parkinson's disease.

