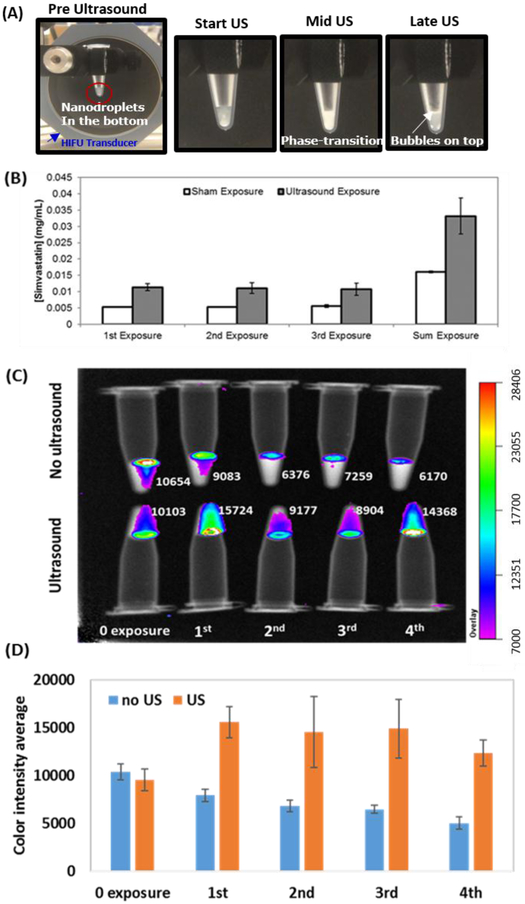
Figure 3.
Release of drug and dye following multiple US exposures (A) Photographs of nanodroplets triggered by HIFU (B) simvastatin concentrations in the supernatant measured after HIFU exposure. Sham exposure (n=2), Ultrasound exposure (n=4). (C) Representative IVIS images and color intensity analysis for dye release. The numbers next each sample represent relative dye concentrations. (D) Average color intensity within each tube (n=3).

