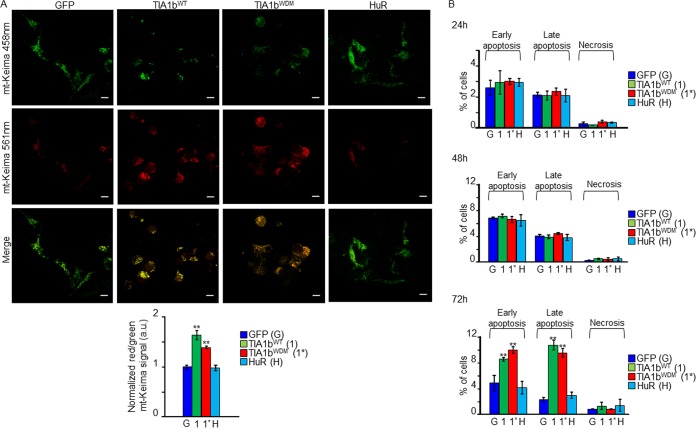
FIG 9.
Expression of WDM-TIA1 triggers mitophagy and apoptosis. (A) Mitophagic flux analysis using the mitochondrial Keima probe. Cells were transiently transfected with the mt-Keima-expressing plasmid and visualized at 3 days postinduction. The histogram shows normalized red/green mt-Keima signals (n = 3) (**, P < 0.01). Bars, 10 μm. a.u., arbitrary units. (B) Estimation of apoptosis rates in cells for 24 to 72 h measured by flow cytometry. Values represent means ± SEM (n = 3) (**, P < 0.01).

