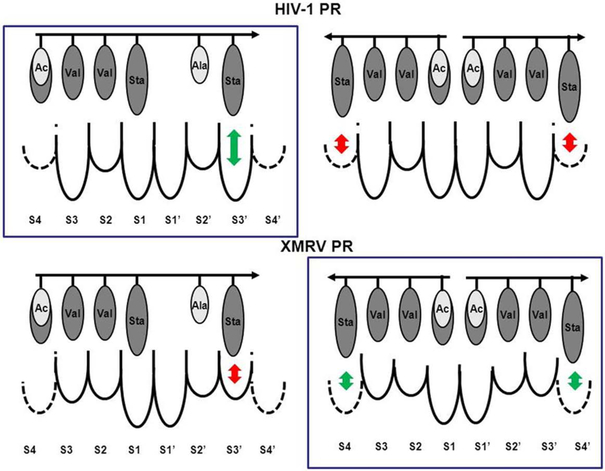
Figure 5. Schematic representation of the binding modes of pepstatin A and acetyl-pepstatin to HIV-1 and XMRV PRs.
Single inhibitor bound-states are presented on the left-hand side, while the two inhibitor bound-states are shown on the right-hand side. Preferred binding modes (based on the crystal structures) are shown in boxes. The arrows show the direction of the inhibitors from its N-terminal end to the C-terminal end, while the circles indicate the residues of the inhibitors. Shades of the residues approximate their hydrophobicity, darker higher and brighter lower. Pepstatin A and acetyl-pepstatin molecules differ only in their N-terminal residue, thus the brighter shade indicates the acetyl group at the N-terminal end of the inhibitor, while the isovaleryl group is indicated in the same N-terminal position with the darker shade. The size of the substrate binding pockets below the dotted lines complements the size of the most preferred residues [7], dashed lines for the S4 subsites indicate that these pockets are less defined than the other ones [7]. Relatively preferred side-chain-subsite interactions are indicated by green arrows and the non-preferred ones by red arrows.

