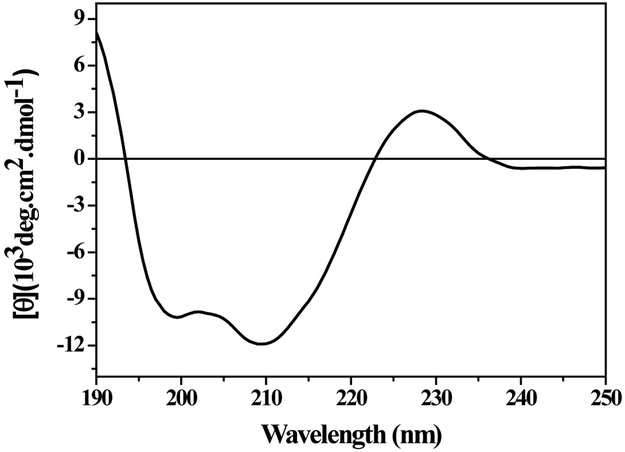
Figure 1.
Measurements of the circular dichroism of CrataBL. A CD spectrum of CrataBL was obtained in 0.01 M PBA pH 7.4, at 25 °C. Measurements are the averages of eight scans using a solution containing 10 μM of protein. CD spectrum deconvolution using CDPro software calculated 2% α-helix, 46% β-sheet, 21% β-turn, 31% irregular structures.

