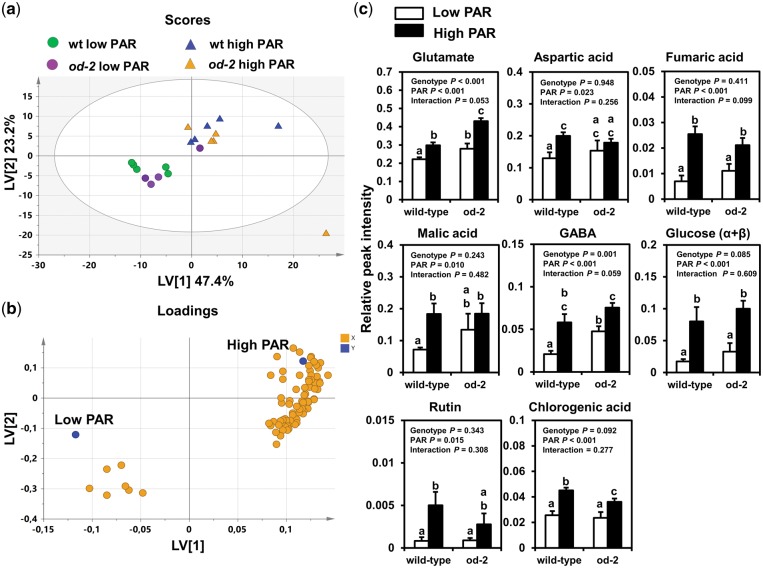
Fig. 5.
Metabolomic responses in wild-type (wt) and odorless-2 (od-2) plants under low or high PAR conditions. Leaf metabolites were analyzed by NMR at 35 d after initial light treatments on leaflets collected from the third/fourth youngest leaf. Projection to latent structures-discriminant analysis (PLS-DA) was performed on the obtained 1H NMR spectra, and resulted in three latent variables (LVs) that cumulatively explained 82% of the total metabolomic variation and 84.6% of the light treatment response, with a 76.3% total model predictability. (a) Score plot showing the first two LVs. (b) Loading plot showing metabolites contributing most to the model (VIP score >1). (c) Relative spectral intensities (mean � SEM, n = 4–5), scaled to the internal standard, of selected metabolites (VIP score >1) identified in the 1H NMR spectra. Different letters above bars denote significant differences among groups (ANOVA followed by Fisher’s LSD test, P ≤ 0.05).

