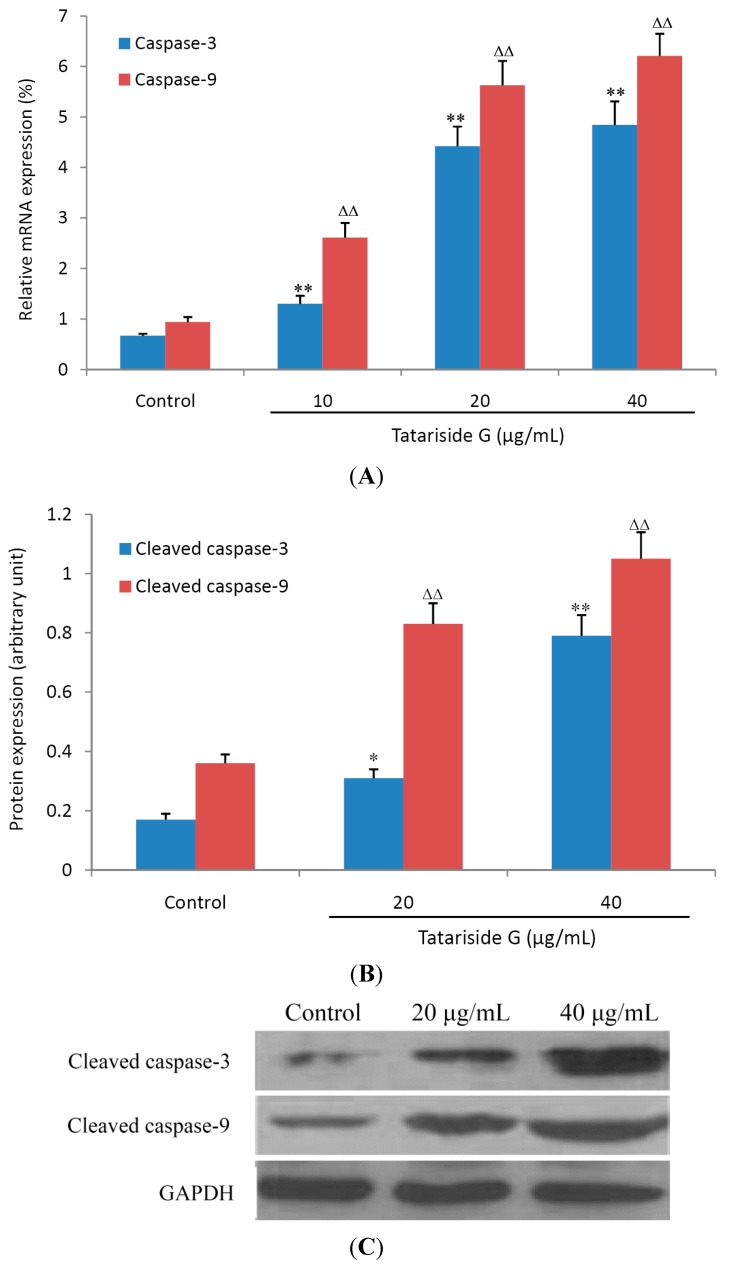
Figure 7.
Effects of tatariside G on the mRNA and cleaved protein expression of caspase-9 and caspase-3. After treatment with tatariside G (10, 20, and 40 μg/mL) for 6 h or 12 h, the mRNA (A) and cleaved protein (B) expression of caspase-9 and caspase-3 was analyzed by FQ-RT-PCR or western blot. (C) Representative western blot picture of HeLa cells treated with tatariside G for 12 h. GAPDH was used as loading control. **, ΔΔ p < 0.01 vs. the control group. Data are expressed as the mean ± SD. n = 6 (A) or 3 (B).

