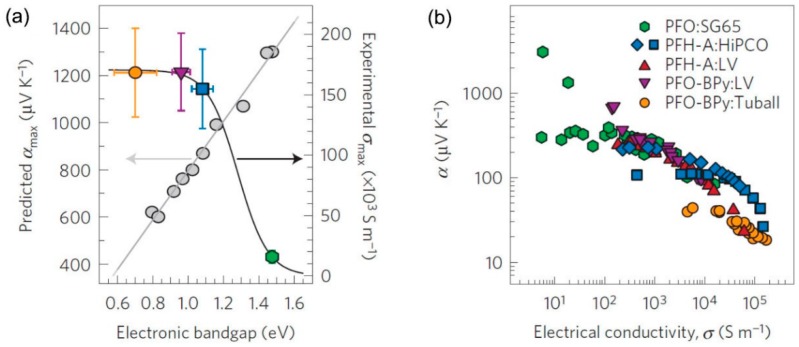
Figure 10.
(a) Dependence of the theoretically predicted peak Seebeck coefficient (grey symbols and grey line) and maximum experimentally measured electrical conductivity (colored symbols and black line) on the semiconducting CNT electronic bandgap. The vertical error bars are derived from the standard deviation of the measured sheet resistances and film thicknesses. The horizontal error bars denote the standard deviation of the electronic bandgap derived from the semiconducting CNT diameter distribution. (b) Experimentally measured Seebeck coefficient as a function of electrical conductivity Reproduced with permission from Ref. [101]. Copyright © Springer Nature, 2016.

