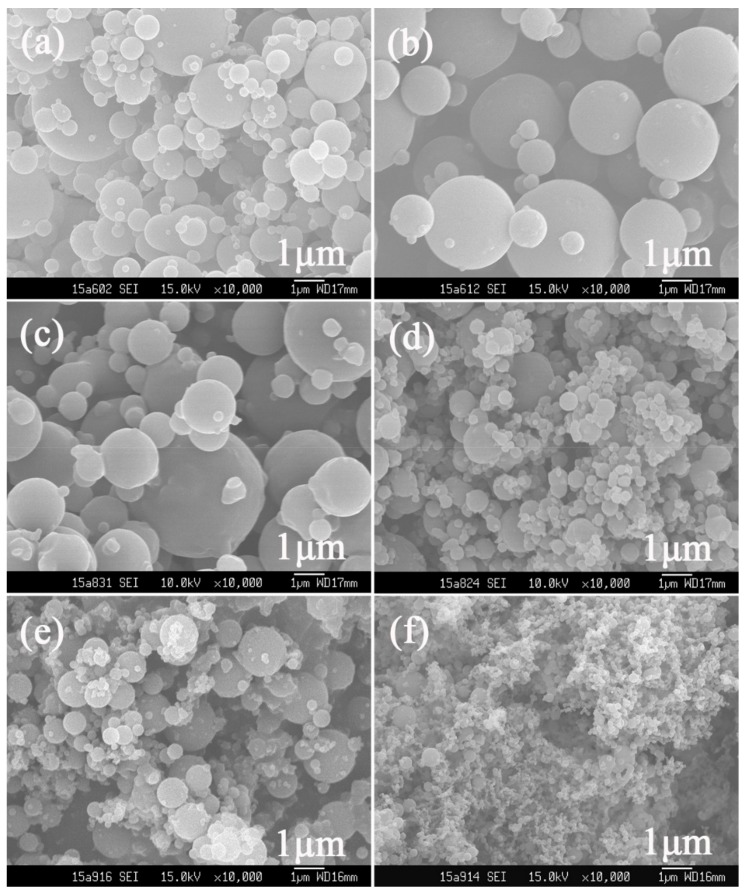
Figure 3.
SEM images of a BP prepared under different conditions (temperature, concentration, pressure): (a) 50 °C, 120 bar, 15 mg/mL, Sample 6; (b) 60 °C, 120 bar, 15 mg/mL, Sample 7; (c) 40 °C, 90 bar, 15 mg/mL, Sample 8; (d) 40 °C, 150 bar, 15 mg/mL, Sample 9; (e) 40 °C, 120 bar, 9 mg/mL, Sample 10; (f) 40 °C, 120 bar, 3 mg/mL, Sample 11.

