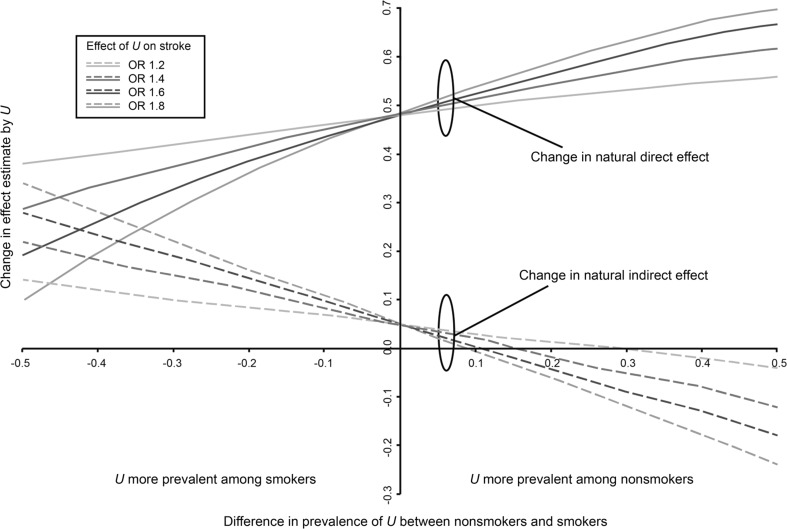
Fig. 4.
Illustrates how a crude natural direct effect estimate of 1.48 and a crude natural indirect effect estimate of 1.05 (the intercept on y-axis) would change under different magnitudes of confounding by a binary unmeasured variable U. The difference between the observed effect and bias-corrected-effect is depicted on the Y-axis, and the difference in prevalence of U between non-smokers and smokers is depicted on the X-axis. The colored lines are a range of plausible values for the effect of U on ischemic stroke. (Color figure online)

