Fig 1.
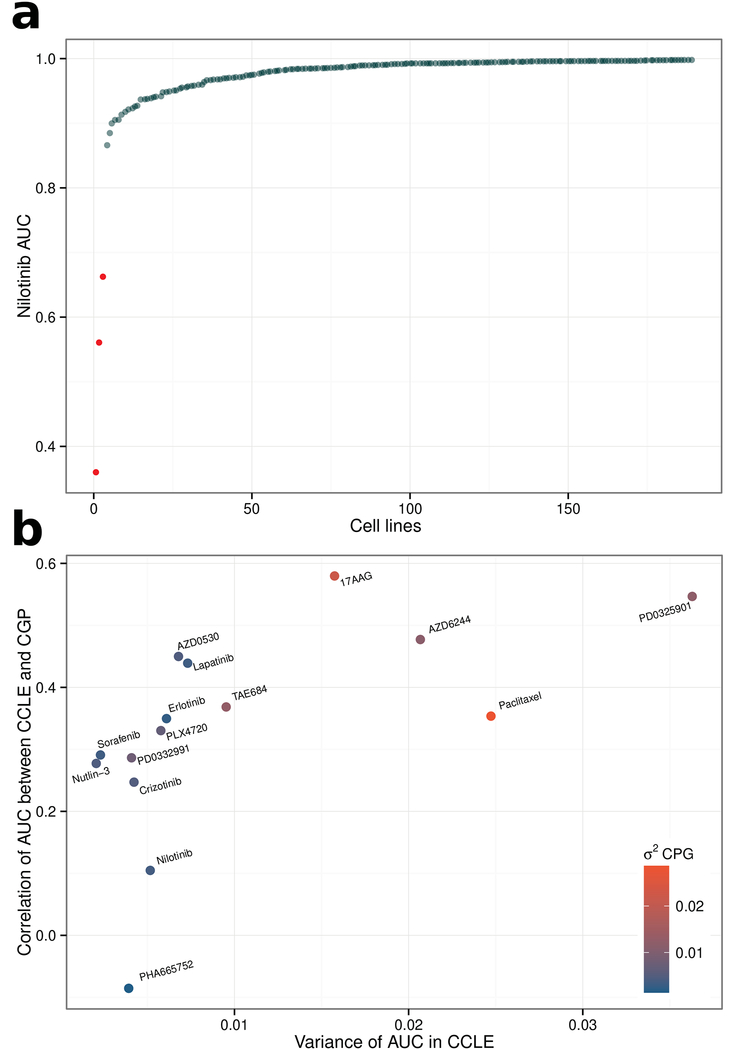
Highly targeted agents (nilotinib) highlight a major limitation of the authors’ test for concordance. Scatterplot showing the nilotinib AUC values (in CGP) for the 189 cell lines that were screened by both CGP and CCLE. Only a very small proportion of cell lines achieve a response, e.g. the three BCR-ABL1 positive cell lines highlighted in red. This almost complete lack of biological variability renders a Spearman correlation ineffective as a means to assess concordance.
(b) The authors’ test for concordance is confounded by variability in drug response. Scatterplot showing the strong association between “Spearman’s correlation of AUC between CCLE and CGP” and “variance of AUC in CCLE”. Drugs whose AUC is more variable are more likely to be highly correlated between CCLE and CGP (rs = 0.83, P = 1.9 × 10⁻⁴). The points have been color coded by their “variance of AUC in CGP”, which is also significantly associated with both “variance of AUC in CCLE” and “Spearman’s correlation of AUC between CCLE and CGP”.

