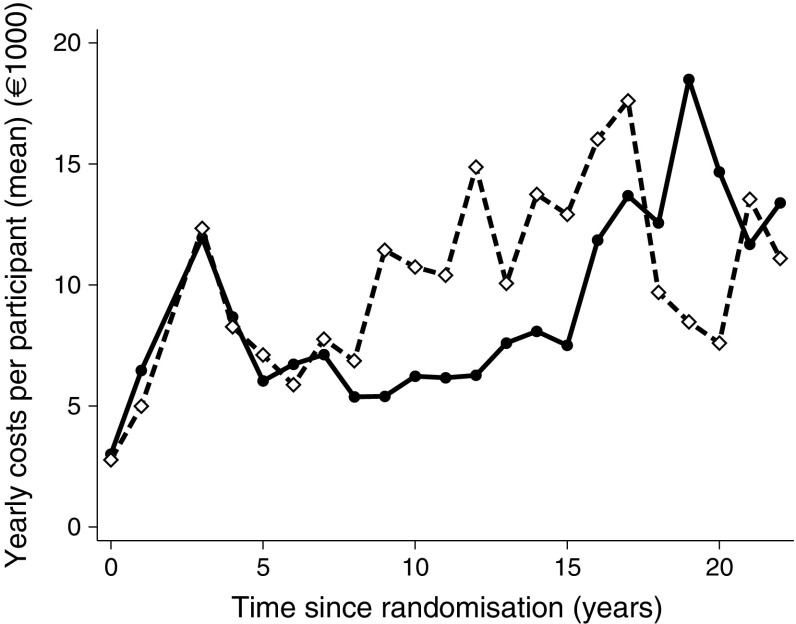
Fig. 1.
Yearly mean direct medical costs per individual (in €) in the two original treatment groups, starting at baseline in 1993. Data are the yearly costs for the group divided by the number of individuals in the group in that year. The peak at 4 years is an artefact from the aggregation of data from years 3 and 4 in some individuals. Solid line, intensified therapy group; dashed line, conventional therapy group

