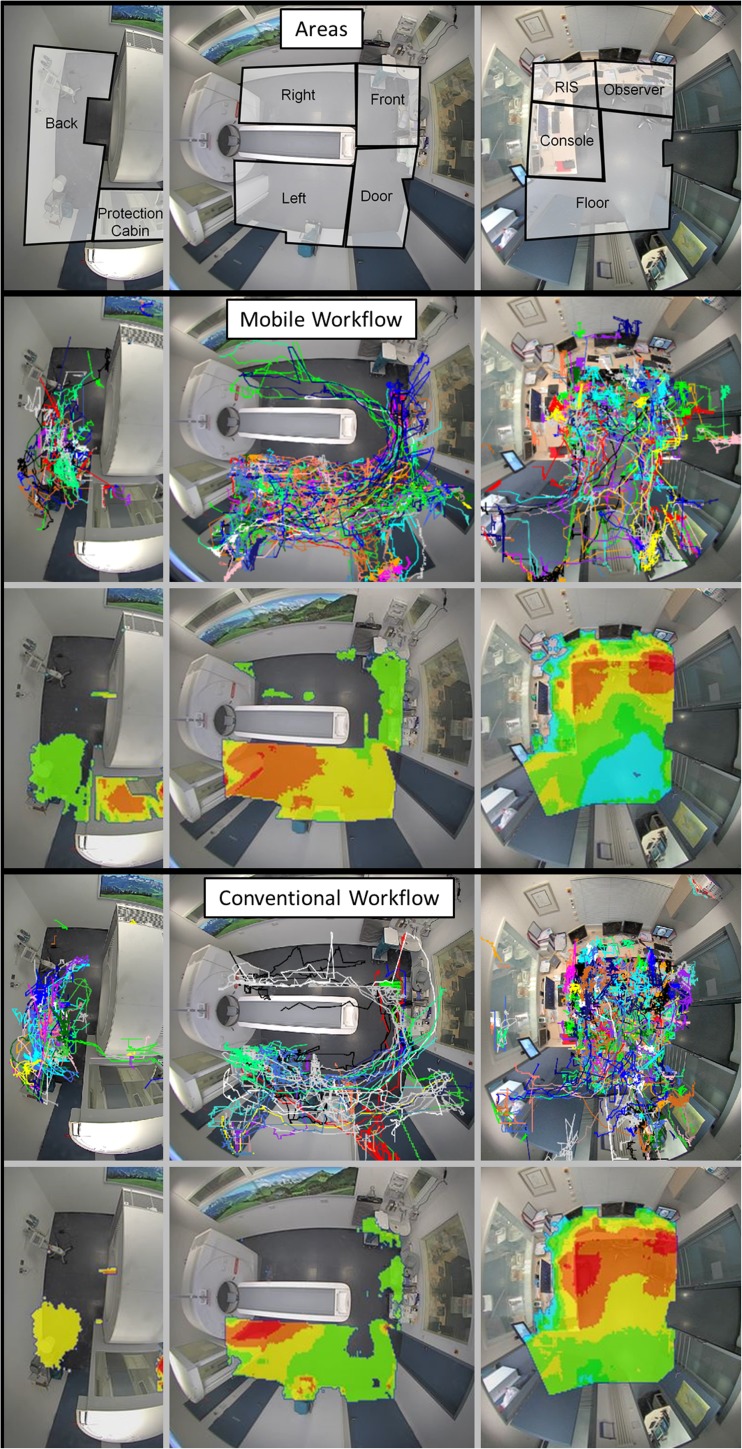
Fig. 3.
Perspective view of the fisheye cameras and sketched virtual areas for quantification of movement. Target lines (upper rows) are recorded and used as input for relative density function heat-maps (bottom rows) in false colours encoding higher (warm colours) or lower (cold colours) presence of persons in the examination room and in the control room

