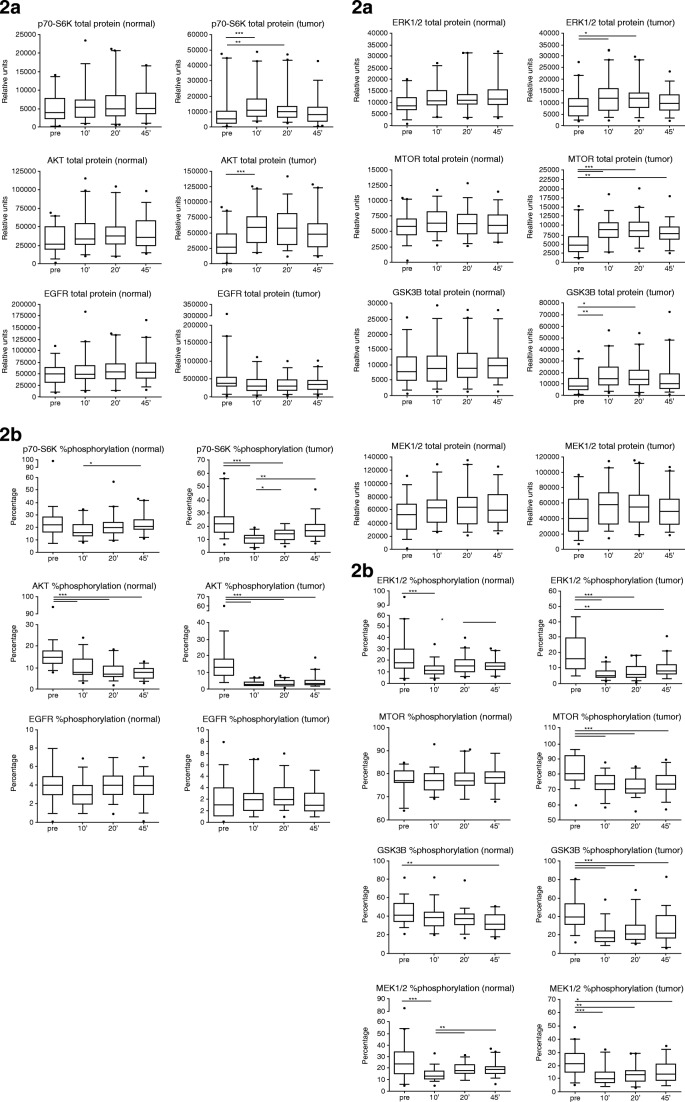
Fig. 2.
Examples of changes of protein expression levels according to increasing cold ischemic time ([36]). a Total protein expression (relative units) of p70-S6K, AKT, EGFR, ERK1/2, MTOR, GSK3B, and MEK1/2 in normal and tumor colon tissue at four timepoints of tissue collection: pre, before hepatic pedicle clamping; 10′, 10 min after resection; 20′, 20 min after resection; and 45′, 45 min after resection.*p < 0.05; **p < 0.01; ***p < 0.001. Box plots indicate the 5/95% confidence interval, median, and standard deviation. b Percentage of protein phosphorylation of p70-S6K, AKT, EGFR, ERK1/2, MTOR, GSK3B, and MEK1/2 in normal and tumor colon tissue at four timepoints of tissue collection: pre, before hepatic pedicle clamping; 10′, 10 min after resection; 20′, 20 min after resection; and 45′, 45 min after resection. *p < 0.05; **p < 0.01; ***p < 0.001. Box plots indicate the 5/95% confidence interval, median, and standard deviation

