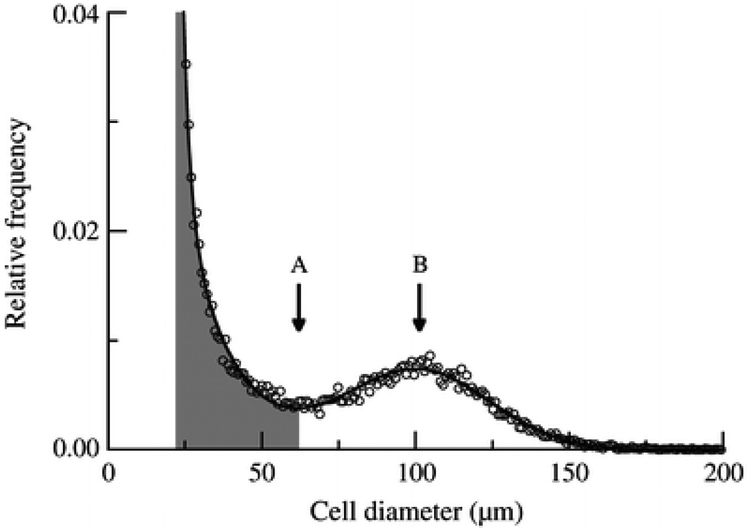
Figure 1.
Multisizer analysis of cell size distribution in a single patient with large cells represented by a Gaussian formula and small cells represented by a double-exponential formula. Fraction of small cells (shaded area) includes all cells below the nadir (black arrow). Peak center is the cell diameter where the Gaussian hump peaks (white arrow).

