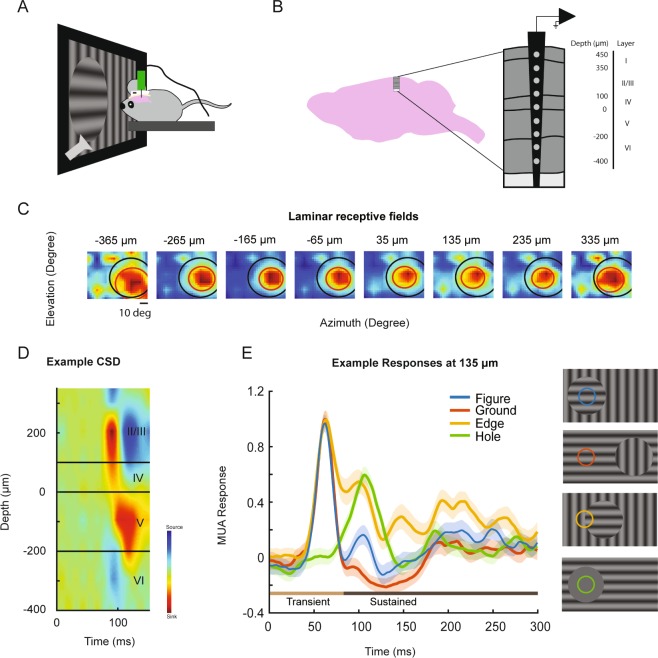
Figure 2.
Electrophysiological recordings. (A) For the V1 recordings, the mouse’s head was immobilized in front of a screen and we presented visual stimuli while using a laminar probe to record V1 activity. Eye position was monitored with an eye tracker. (B) We inserted a laminar electrode with a spacing of 100um between the recording sites into primary visual cortex (C) RFs of the different recording sites of an example penetration (see Methods). Red ellipses represent the full width at half maximum of a 2D-gaussian fitted to the response profile to estimate the RFs. Black line indicates the perimeter of the figure stimulus. (D) CSD of the same penetration. The bottom of the early sink demarcates the boundary between L4 and L5. This sink provides an estimate of the position of the electrode and was used to align the data of different penetrations. (E) MUA responses elicited by the visual stimuli (illustrated on the right) at one example recording site in layer 2/3. The color of the traces corresponds to the color of the receptive field on the visual stimuli shown on the right. The shaded area shows the SEM across trials.

