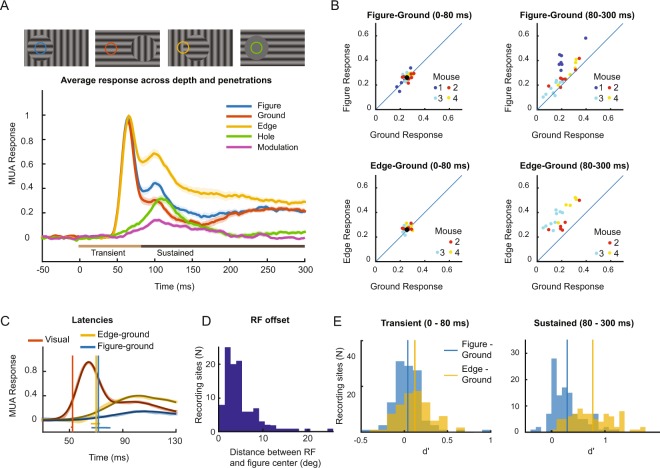
Figure 3.
Multi-unit activity elicited by the figure-ground stimuli in V1. (A) The V1 MUA response elicited by the different stimuli, averaged across all layers of the 21 penetrations for which all four stimuli were presented. The shaded area indicates the SEM across penetrations. (B) Comparison of activity elicited by the figure and background (top) and the edge and background (bottom) during the early (0–80 ms, left) and late time-window (80–300 ms, right). Data from the different mice are shown in distinct colors. Each data point represents the average activity across all recording sites of one penetration. (C) The latency of the visual response and the figure-ground modulation was determined with a curve-fitting method (see Methods). Thick lines show the data and thin black lines the fits. The vertical lines show the estimated latency of the visual response (red), the difference between the edge and background response (yellow) and the difference between the figure and background response (blue). The horizontal lines indicate the 95% confidence interval of the latencies as determined with a bootstrapping method. The red horizontal line is difficult to see because the 95%-confidence interval is very narrow. (D) Distribution of the distance between the center of the RFs of the MUA recording sites and the figure center. (E) Distribution of d′ values of the MUA for discriminating between figure and ground (blue) and between edge and ground (yellow) during the early, transient (0–80 ms, left) and late, sustained time-window (80–300 ms, right).

