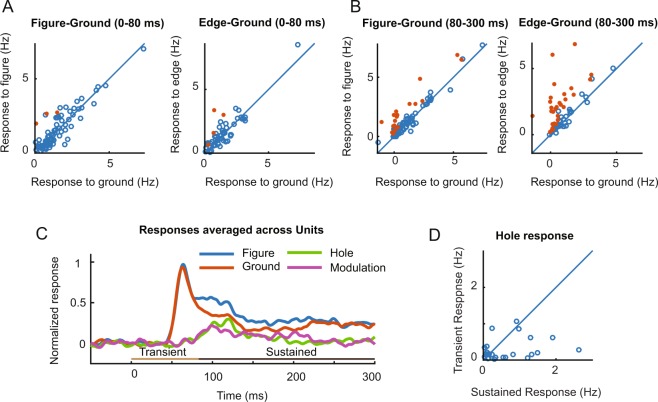
Figure 4.
Figure ground modulation of single V1 neurons. (A) Comparison of firing rates of single units in V1 during the early time-window (0–80 ms) elicited by the figure center and background (left, N = 85), and elicited by the figure edge and background (right, N = 59). Red dots illustrate neurons for which the response differed significantly (p < 0.05). (B) Same as A, but during the later time-window (80–300 ms). (C) Average V1 response of single units (N = 59). Before averaging, the activity of individual neurons was normalized by first subtracting the baseline activity and then dividing by the peak response in the ground condition. The purple trace illustrates the time course of figure-ground modulation, which is the difference between the activity elicited by the figure and the background (i.e. blue minus red curve). The green trace shows the average response to the hole condition. The horizontal lines above the x-axis illustrate the early (light brown, 0–80 ms) and late time-windows (dark brown, 80–300 ms) used in the analysis. (D) Single unit response upon presentation of ground and hole stimuli during the transient (y-axis) and the sustained phase (x-axis) (N = 59).

