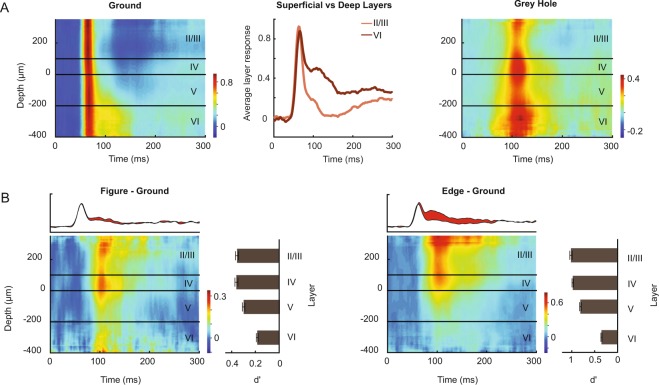
Figure 5.
Laminar profile of figure ground modulation of V1 MUA. (A) Laminar profile of the MUA response elicited by a homogeneous grating (left) and by the stimulus with the grey hole (right). X-axis, time; y-axis, laminar depth. The middle panel compares the response evoked by the ground in the superficial and the deep layers. It can be seen that the activity is more sustained in the deep layers. (B) Laminar profile of the figure-ground modulation, i.e. the difference in activity evoked by the figure and the background (left) and the edge and the background (right). The average activity across the layers is shown in the panel above and the figure-ground modulation in red. Right panels, the average d′ values during the sustained response phase (80–300 ms) in the different layers.

