Figure 6.
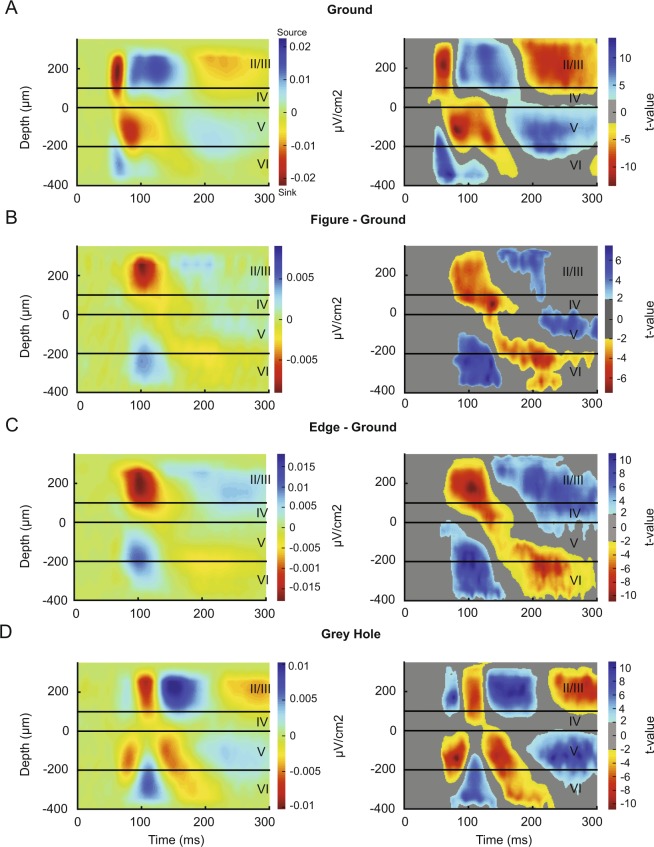
Analysis of the CSD. (A) left, CSD profile evoked by the background stimulus. Sinks are shown in warm colors and sources in cool colors, the values are in μV/cm2. The boundary between layer 4 and 5 was determined as the lower border of the early sink with a clear reversal visible at the depth marked as 0. Right, we determined the significance of the sinks and sources using a method based on clustering t-tests (see Methods). Significant (p < 0.05) sinks are shown in warm colors and significant sources in cool colors, the color indicates t-value. All sinks and sources that are visible in the left panel turned out to be significant. (B) Difference in the CSD profile evoked by the figure and the background. Note that the figure is associated with an extra sink in layer 2/3 that coincides with the increase in spiking activity. (C) The difference in the CSD between the edge and the background. The laminar profile is similar to that in panel B, but the edge elicits a slightly stronger sink in layer 2/3. (D) Laminar CSD profile evoked by the grating stimulus with a grey hole at the RF location. Note the initial sink in layer 5, which is followed by a CSD profile that resembles the one in panel B.

