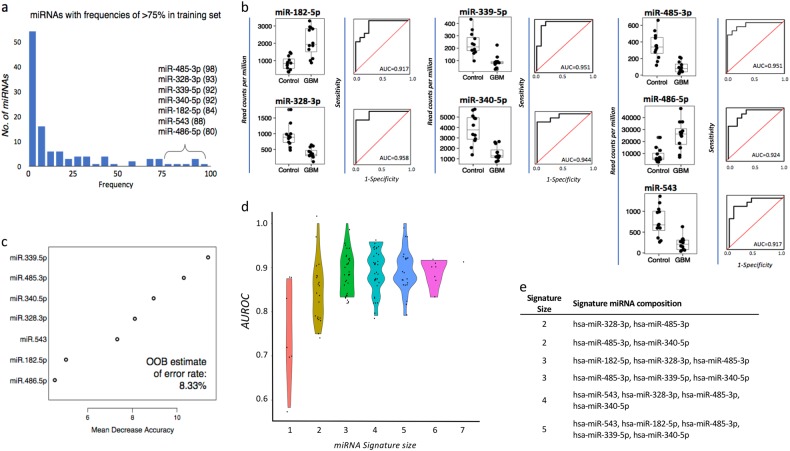
Fig. 3.
a miRNAs appearing in >75 of the 100 partitions (70% training set, 30% test set) were selected as the most stable miRNA classifiers by Random Forest modeling (frequencies are specified in brackets). b Box-and-whisker plots and receiver operator characteristic curves with area under the curve (AUROC) calculations demonstrate the individual discriminatory power of the seven most stable miRNA classifiers. c miRNAs were ordered by the importance of their contribution to discriminating GBM from [healthy] controls; overall out-of-the-bag (OOB) error rate of the seven features was 8.33%. d AUROC measures of all possible combinations of the seven miRNAs previously identified to be the most stable predictors, stratified by the number of miRNAs (signature size) and their distributions, and displayed as violin plots. e miRNA signatures that discriminate between GBM and healthy controls with perfect accuracy

