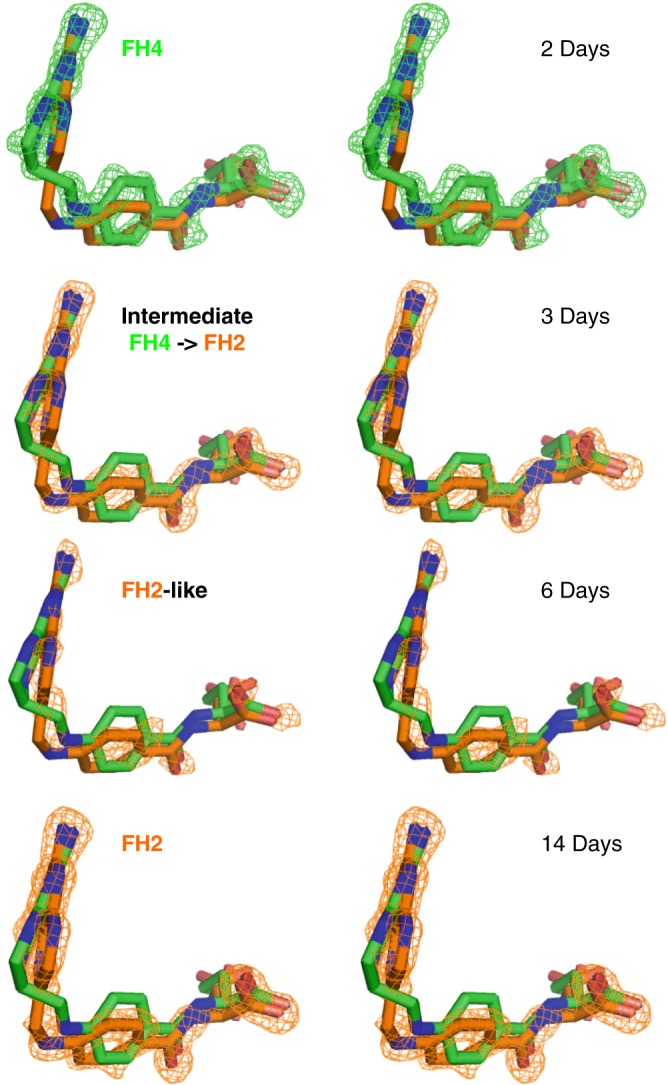
Fig. 3.

Stereo views of the time course of Fo–Fc omit electron density map changes corresponding to the conversion of FH4 to FH2. The Fo–Fc omit electron density maps contoured around the ligands are shown at 3.0σ level. The eDHFR:FH4 binary complex crystals were grown in the dark at room temperature. At each time point, a single crystal from an independent crystal drop was harvested by flash freezing for X-ray diffraction. The ligand structures of FH4 and FH2 of fully refined binary complex structures at 2 and 14 days, respectively, are shown in each figure as references to compare with the change of electron densities. The omit maps for the crystals harvested at 3 and 6 days were generated after initial structural refinement without introducing ligands or solvents. Superposition of the protein structures was performed using PyMOL69
