Fig. 4.
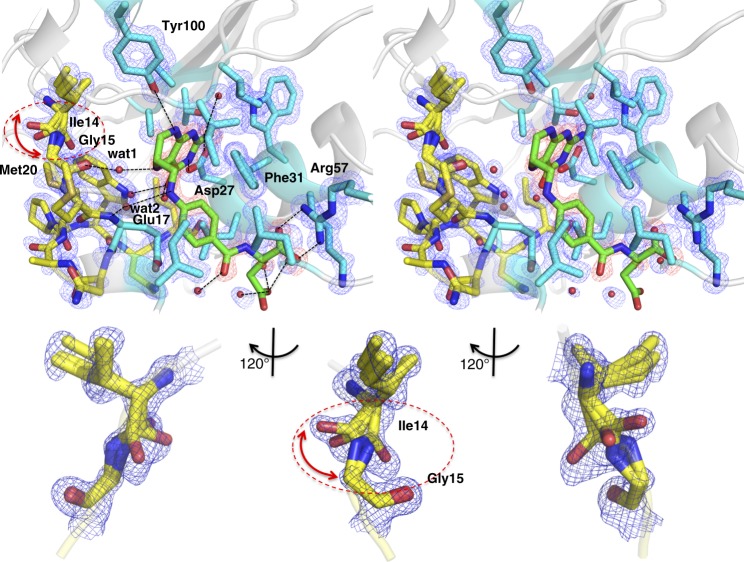
The active site structure of the eDHFR:FH4 complex shown in stereo views. a Side chains (cyan) within 4 Å of FH4 (green) and the Met20 loop (yellow) are shown as sticks. Secondary structures are displayed as cartoons in gray, and waters within 3.5 Å of FH4 as spheres. Polar interactions with FH4 are indicated with dashed lines. The Fo–Fc electron density map omitting FH4 is shown at a 3.5σ level in red and the 2Fo–Fc omit map at a 1.0σ level is shown in blue for residues and waters. The three conformers of Ile14-Gly15 amide linkages are indicated by a dashed circle and red arrows. b An expanded view of the Ile14-Gly15 linkage

