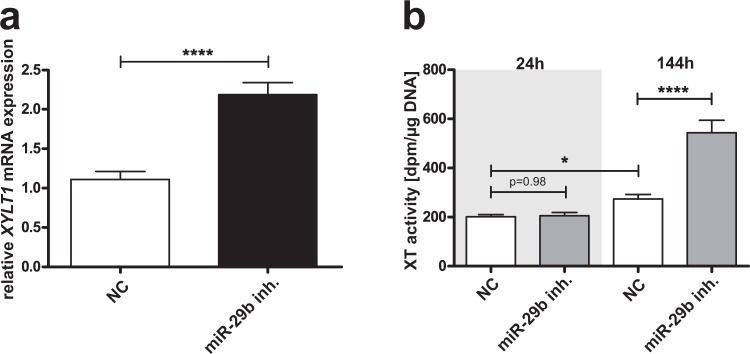
Figure 3.
Influence of miRNA-29b inhibitor on the XYLT1 mRNA expression level and XT activity in NHDF. NHDF cell lines (n = 2) were seeded and transfected with miRNA-29b inhibitor (miR-29b inh.) or a control miRNA (NC). The relative XYLT1 mRNA expression level was determined by quantitative real-time PCR after 48 h. Data were normalized to a normalization factor calculated from the geometric mean of HPRT, GAPDH and B2M mRNA expression levels. The values indicated are expressed as ratio to one cell line (a). The XT activity (b) was quantified after 48 and 144 h in cell culture supernatants by using a radiochemical enzymatic assay. The XT activity in dpm was referred to the DNA content of the appropriate cell lysate. Values are means +/− SEM for three biological replicates per cell line; *p < 0.05; ****p < 0.0001 (Mann-Whitney U test).

