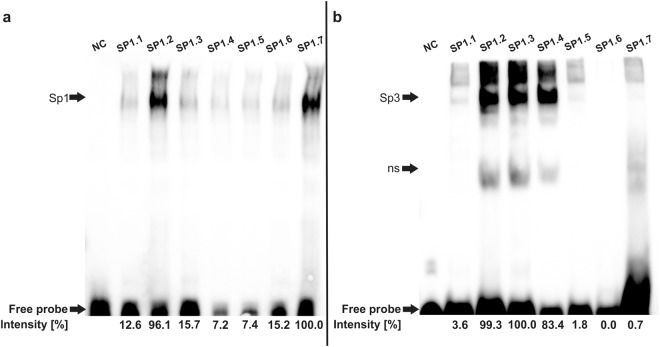
Figure 7.
Results of the electrophoretic mobility shift assay depicting Sp1 and Sp3 binding to Sp1 transcription factor binding sites identified in silico in the XYLT1 promoter region. Biotin-labeled DNA probes corresponding to Sp1 transcription factor binding sites SP1.1 to SP1.7 were incubated with recombinant Sp1 (a) or Sp3 (b) protein and analyzed on two independent gels (separated by the black line). In each line 1 (NC), an unlabeled DNA probe was used to demonstrate specificity of DNA-protein binding. Sp1 or Sp3 binding to the appropriate DNA probes was relatively quantified by using ImageJ while only a comparison between samples on one gel was performed. The strongest band in (a) or (b) represents the strongest binding of DNA to protein and was defined as 100%. ns: unspecific binding. Full-length gels (with total free probe band) are presented in Supplementary Figs S1 and S2.

