Figure 2.
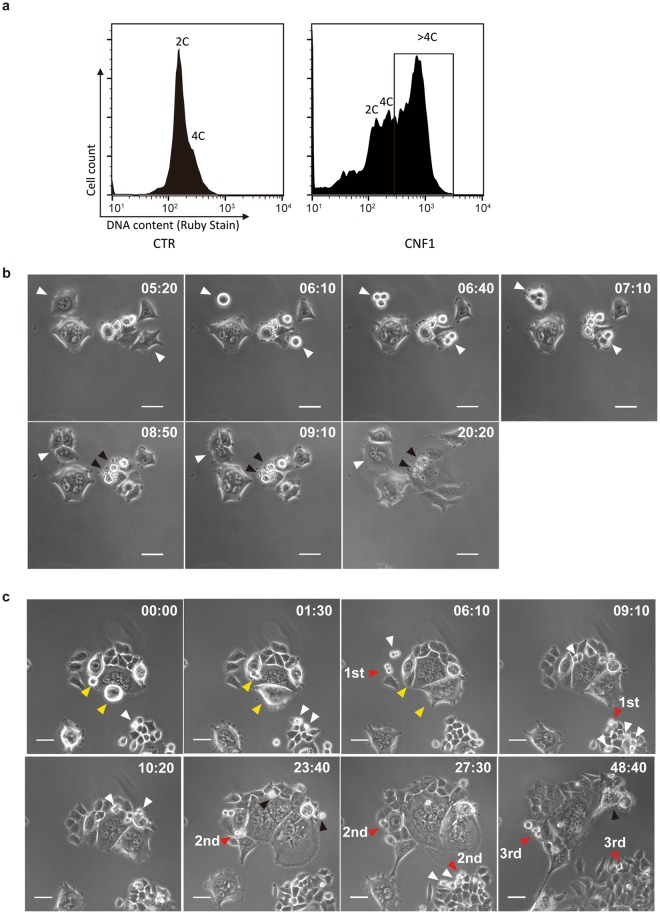
Survival of polyploid HCT-116 cells through depolyploidisation. (a) FACS sorting of polyploid HCT-116 cells (DNA content >4 C) after treatment with 5 nM CNF1. (b) Representative time-lapse images of depolyploidisation of polyploid HCT-116 cells in the first 7 days after CNF1 treatment. Time is indicated in hours and minutes (h:min). White arrowheads indicate successful mitotic re-entry and cell division; Black arrowheads indicate failed mitotic re-entry and cell death. Bars, 50 μm. (c) Representative time-lapse images of depolyploidisation of polyploid HCT-116 cells in second 7 days after CNF1 treatment. Time is indicated in hours and minutes (h:min). White arrowheads indicate successful mitosis and cell division; Red arrowheads indicate stable proliferation of daughter cells over three generations; Yellow arrowheads indicate failed mitotic entry; Black arrowheads indicate cell death. Bars, 50 μm.

