Figure 1.

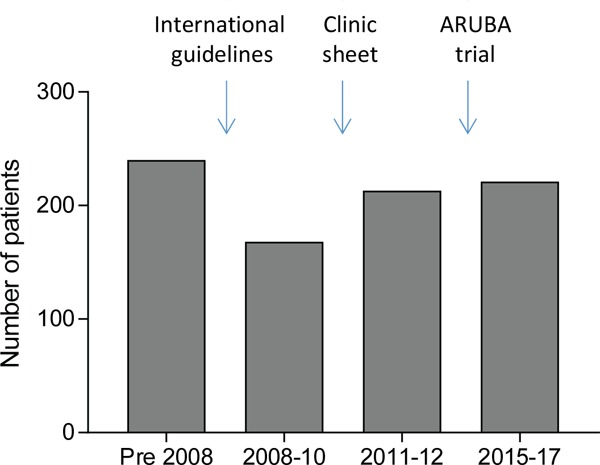
Audit time periods and boundaries. Number of patients refers to number of HHT cases audited across the 4 time periods. Bar charts indicate the % (mean) and 95% confidence intervals of the mean.

Audit time periods and boundaries. Number of patients refers to number of HHT cases audited across the 4 time periods. Bar charts indicate the % (mean) and 95% confidence intervals of the mean.