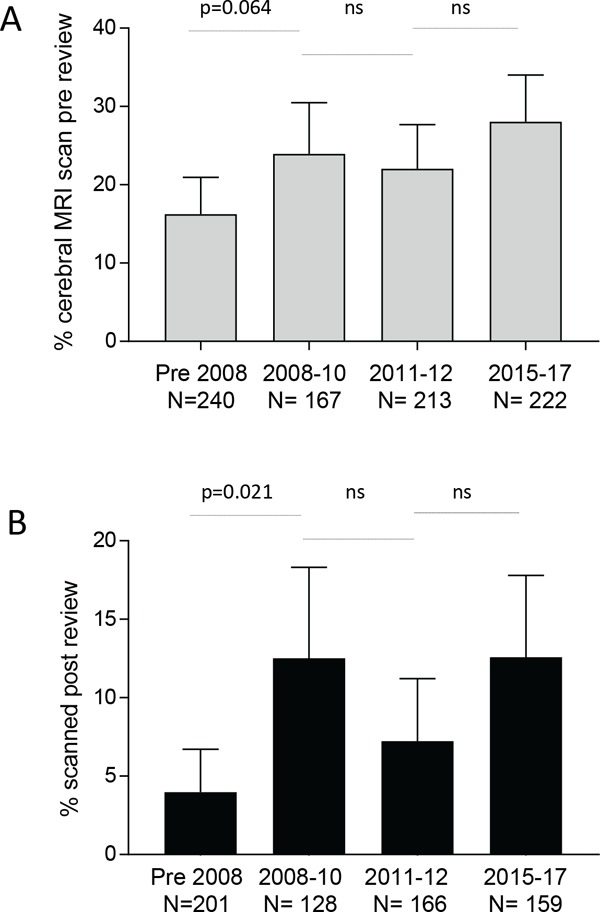
Figure 2.

Overall MR scans rates. Percentage of 842 patients audited who had MR scans performed for any indication, across the 4 time periods as in Figure 1: (A) Prior to review by us (external scans), and (B) Following review by us (internal and external scans). Bar charts indicate the % (mean) and 95% confidence intervals of the mean. Displayed p-values calculated by Dunn's test after Kruskal Wallis (overall p-values A: p = 0.023; B: p = 0.0091).
