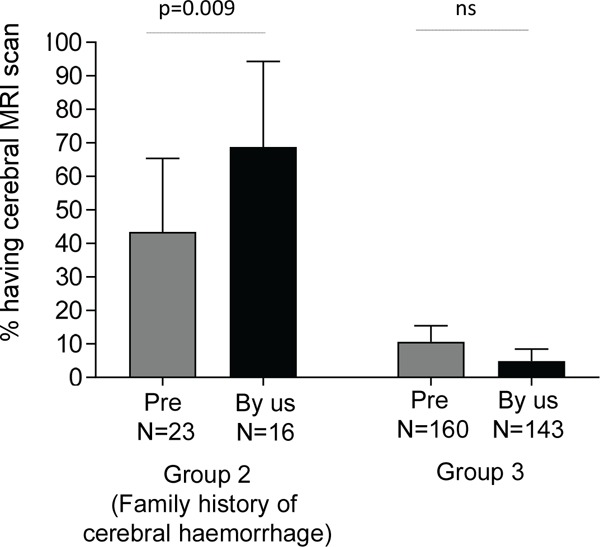
Figure 3.

Proportion of non-symptomatic cases undergoing screening scans in 2015-2017. Patients are categorised by family history of haemorrhage (Group 2), and by whether the scans were performed by other institutions (grey bars, "Pre") or at our institution (black bars, "By us"). Bar charts indicate the % (mean) and 95% confidence intervals of the mean. Overall Kruskal-Wallis p < 0.0001, displayed p-values calculated by Dunn's test.
