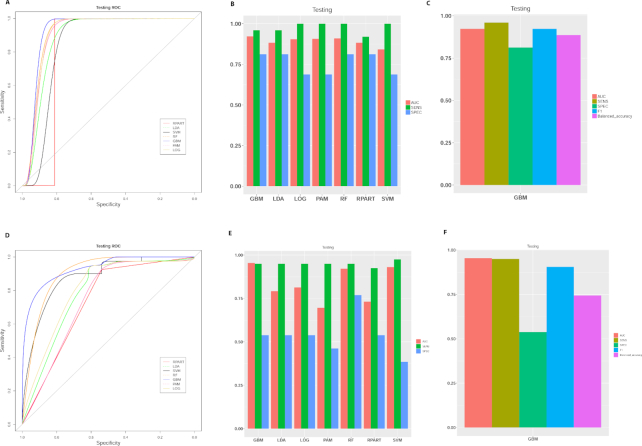
Figure 5:
Model evaluation on the two exemplary datasets. (A-C) Dataset 1, breast cancer vs healthy control plasma samples. (D-F) Dataset 2, ER+ vs ER− breast cancer tissue samples. (A, D) ROC curves of the breast cancer diagnosis testing set, obtained from seven classification algorithms: recursive partitioning and regression analysis (RPART), linear discriminate analysis (LDA), support vector machine (SVM), random forest (RF), generalized boosted model (GBM), prediction analysis for microarray (PAM), and logistic regression (LOG). (B, E) Metrics (AUC, sensitivity, specificity, and F-1 statistic) to measure the performance of classification on training or testing data. (C, F) Metrics of the best-performing model on testing data, based on the criteria chosen by the user (AUC in this case).

