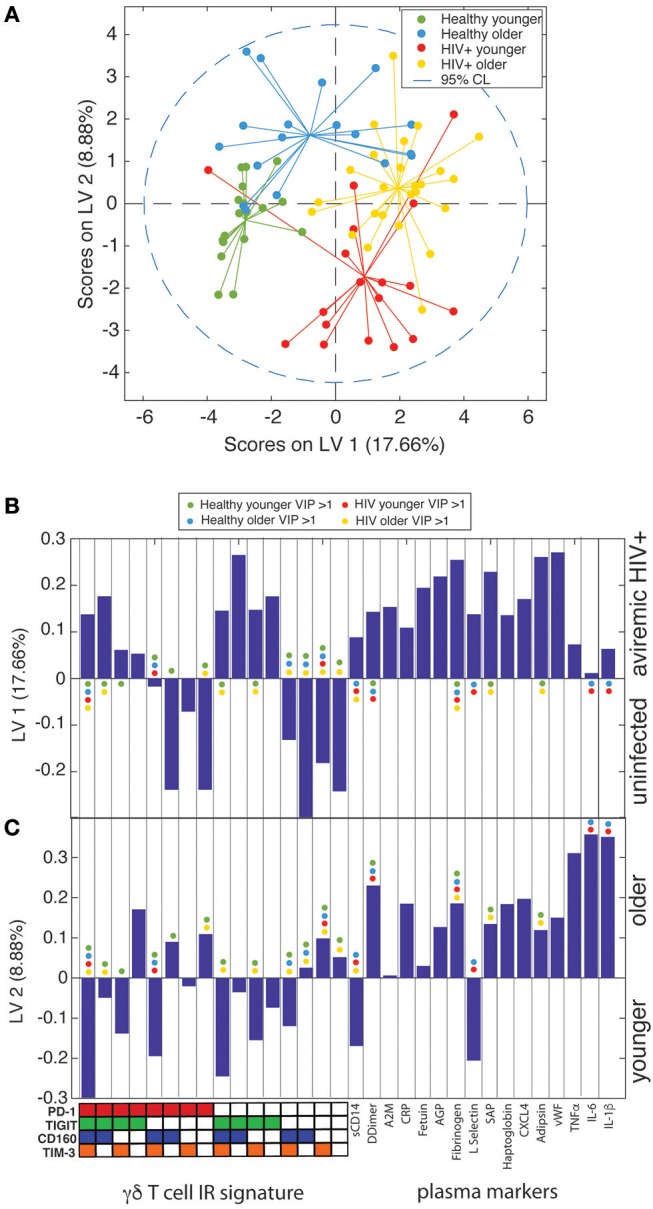
Figure 6.

γδ T cell IR signatures and plasma inflammatory cytokines define the divergent aging processes in ART-suppressed HIV+ individuals and uninfected controls. (A) A two-dimensional PLS-DA model constructed using the percentages of all possible combinations of the IRs PD-1, TIGIT, CD160, and TIM-3 and 16 markers of inflammation and coagulation in plasma. Each data point represents scores generated by the model, composed of all measurements for a given subject mapped onto the two-dimensional latent variable space. The percentages on the axes show the percent variance in the dataset captured by a particular LV. Dotted line shows the 95% confidence interval. (B) Bar plot showing the loadings on LV1 of all parameters used to train the PLS-DA model, which included all possible combinations of the IRs PD-1, TIGIT, CD160, and TIM-3 and the concentrations of all 16 plasma markers measured. LV1 is the latent variable that separated the scores predominantly based on presence or absence of HIV infection. The Y-axis quantifies the positive or negative contribution of a particular parameter to the indicated LV. (C) Bar plot as in (B), showing the loadings on LV2, the latent variable that separates the scores affected by patient age, of all parameters used to train the model. The colored dots in (B,C) mark the parameters (IR signatures of γδ T cells and plasma markers) with a VIP score >1 (statistically significant) for each subject group in the model.
