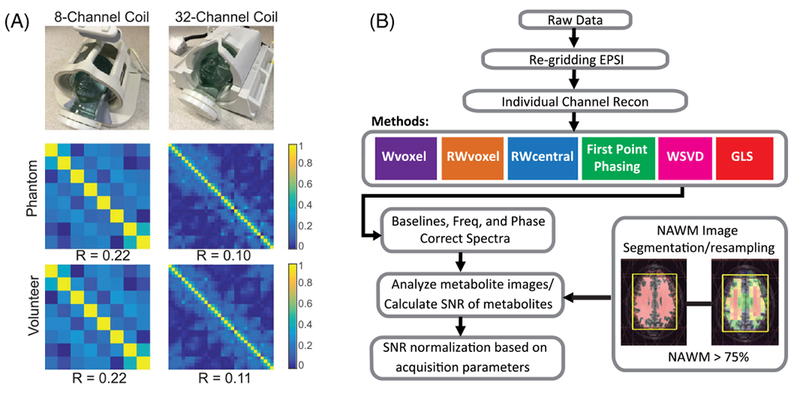
FIGURE 1.

A, Noise correlation levels among channels for both head-coil arrays for phantom and in vivo data. The noise correlation matrices were estimated by calculating the correlation matrix of the noise of the data acquired with RF excitation disabled, demonstrating low noise correlation among the coil elements, with mean values of off-diagonal correlation coefficients being 0.22 for 8-channel and 0.11 for 32-channel. The 32-channel case shows smaller noise correlation compared with the 8-channel one for both phantom and in vivo experiments. B, 3D MRSI processing diagram. The steps used to process the data included reconstruction of individual channel spectral arrays, coil combination and post-processing to perform baseline subtraction, removal of residual phase variations in the metabolite peaks and quantification of peak intensities
