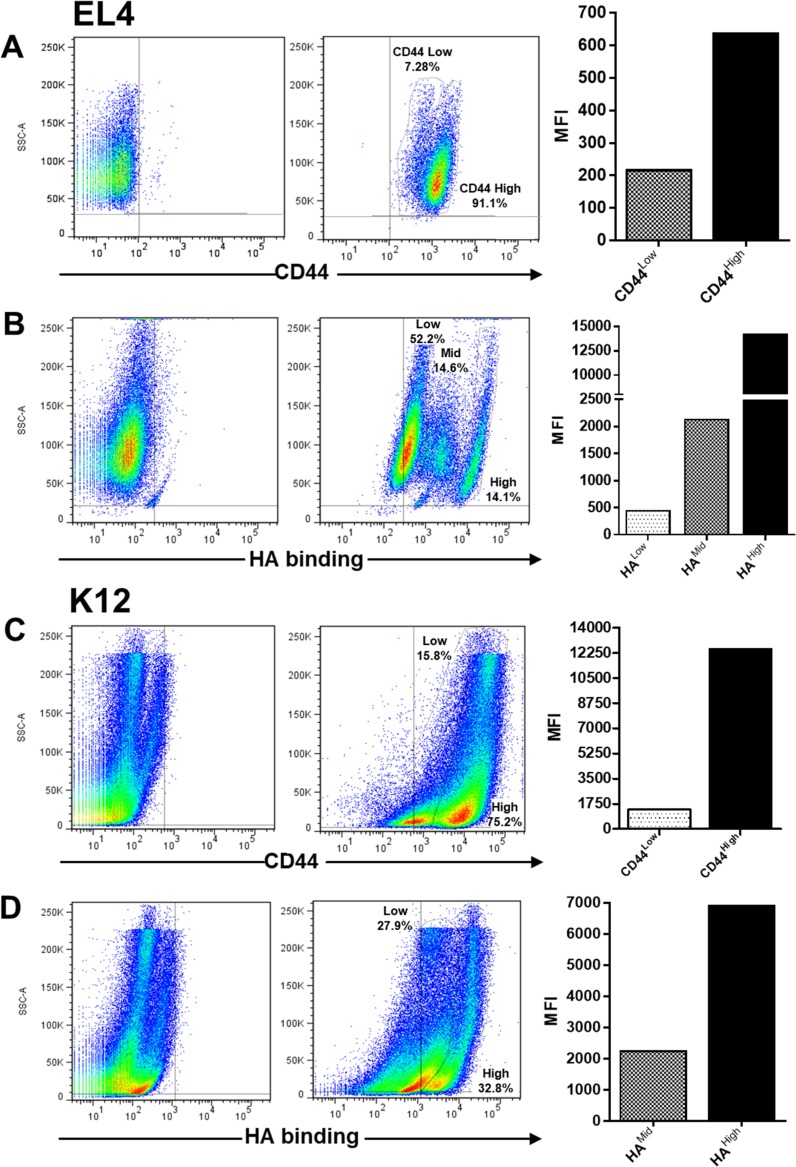
Figure 1.
Flow cytometry analysis of CD44 expression and hyaluronan (HA) binding ability in EL4 (A and B) and K12 (C and D) cell lines. Graphs show the Mean Fluorescence Intensity (MFI) of cell populations with different CD44 expression level and HA binding ability, representative of three independent experiments.

