
Figure 3. TUNEL assay.
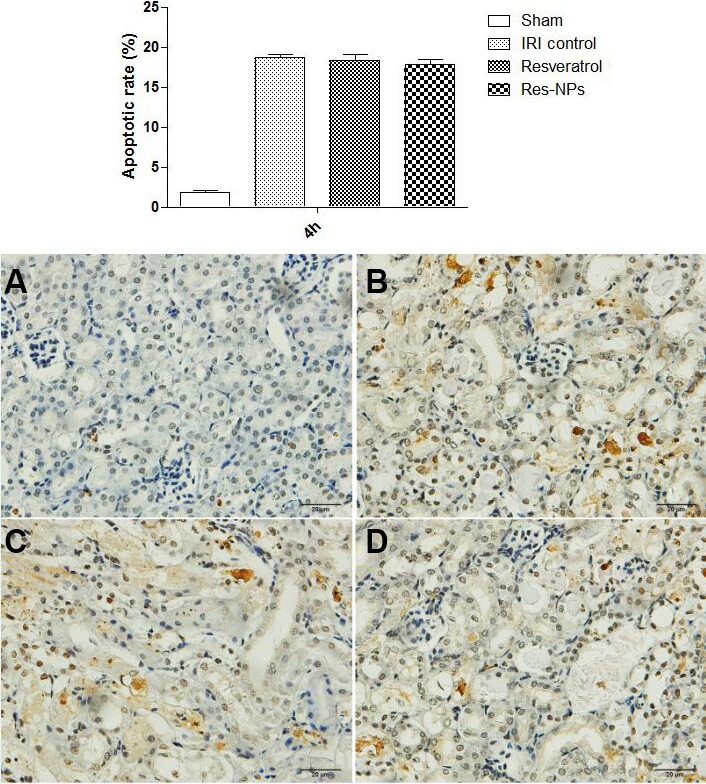
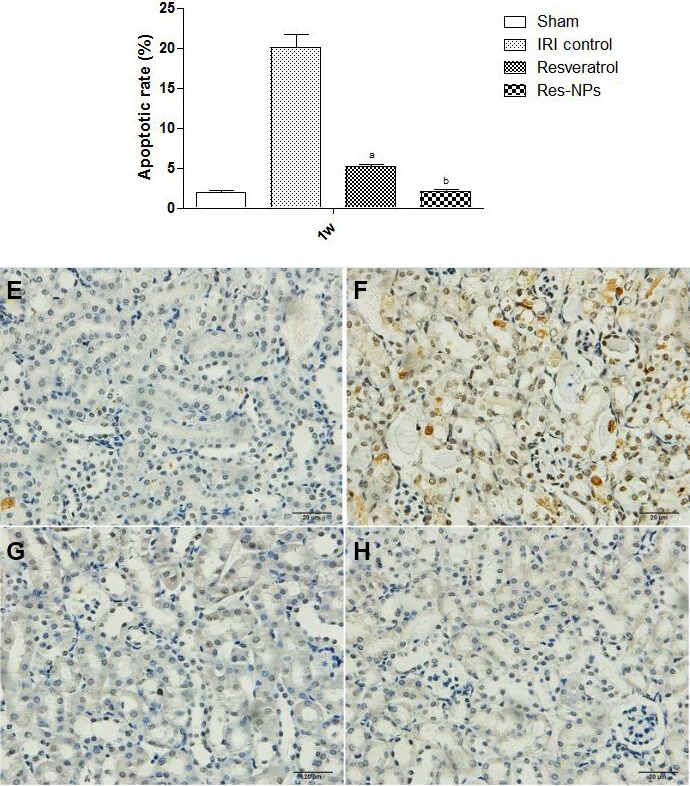
The representatives of apoptosis rate at 4 h are showed in (A–C) and (D) (Figure 3A); (E–H) and h indicate the data at 1 week ((Figure 3B); (A) the difference between IRI control and Resveratrol group is significant (p < 0.05); (B) there is a significant difference (Res-NPs VS Resveratrol) (p < 0.05).