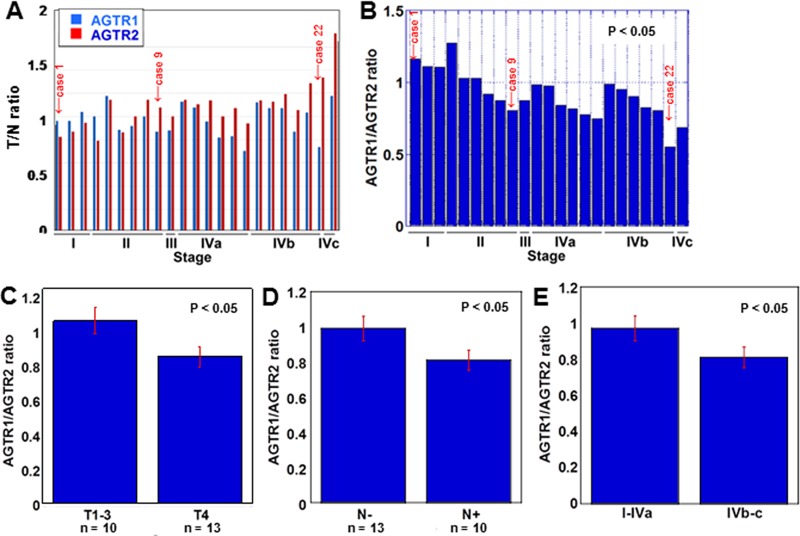
Figure 1. AGTR1 and AGTR2 mRNA expression in 23 OSCC cases.
(A) The expression of AGTR1 and AGTR2 was examined by qRT-PCR in tumor tissues and the coupled non-cancerous mucosae. The ratio of the expression in tumor to non-cancerous mucosa (T/N ratio) was sorted by the pathological stage of the samples [16]. (B) The ratio of AGTR2 to AGTR1 expression was sorted by the pathological stage of the samples. (C–E) AGTR2/AGTR1 ratio according to tumor invasion (T factor, C), nodal metastasis (N factor, D) and pathological stage (E). Error bar, S.D.

