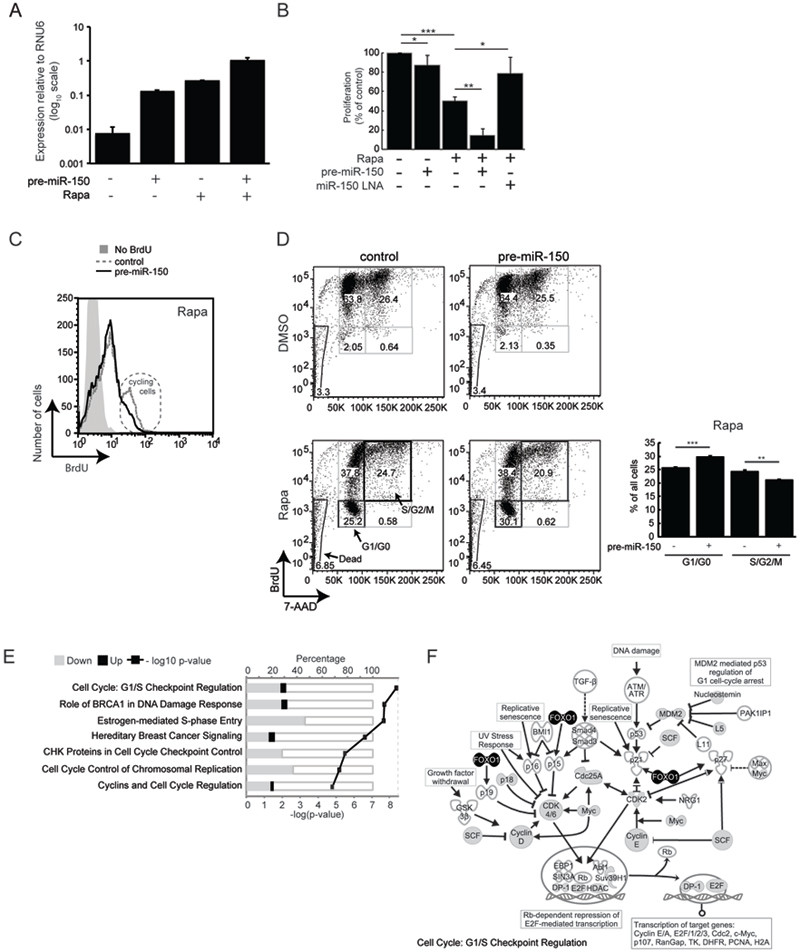
Figure 2. miR-150 inhibits proliferation and reinforces a rapamycin-induced cell cycle arrest.

(A) Over-expression of miR-150 was achieved by transfecting Jurkat cells with a lentiviral vector containing the pre-miR-150 sequence flanked by ~400 bp of native genomic DNA and a GFP reporter. Cells were treated with DMSO or rapamycin 3–4 h after transfection and expression of mature miR-150 was quantified by qRT-PCR 48 h later. (B) Cell proliferation in response to rapamycin treatment, miR-150 over-expression, and/or miR- 150 knockdown. Proliferation was measured by BrdU ELISA and normalized to DMSO- treated cells transfected with a scrambled pre-miRNA hairpin or a scrambled LNA. (C) BrdU incorporation was quantified by flow cytometry. Plots are gated by forward and side scatter to exclude dead cells and mean fluorescence intensity (MFI) is displayed on the x-axis. Control MFI = 9.32; pre-miR-150 MFI = 7.53, p-value = 0.0082. The population of cycling cells (2x higher BrdU content) is circled. Data are representative of 3 experiments. (D) Cell cycle analysis of cells over-expressing miR-150 or a scrambled hairpin control and treated with DMSO or rapamycin for 48 h; BrdU was added in the last 24 h. All acquired cells are displayed and numbers within gates indicate percentages of the total cells. Bar graph summarizes percentages of rapamycin-treated cells in the G0/G1 and S/G2/M phases. (E) Genes that changed expression in response to miR-150 over-expression are enriched within these signaling pathways. Enrichment was calculated using Ingenuity Pathway Analysis software and the top 7 pathways are shown (Fisher’s exact t-test p-value < 1.6e-05). (F) Specific molecules in the “Cell Cycle: G1/S Checkpoint Regulation” pathway from (E). Gray fill - genes down-regulated by miR-150 over-expression, black fill - genes up-regulated by miR-150 over-expression. Data are shown as mean ± S.D, n = 4. * p < 0.05, ** p < 0.005, *** p < 0.0005 (Student’s t-test). All data are representative of at least 3 independent experiments.
