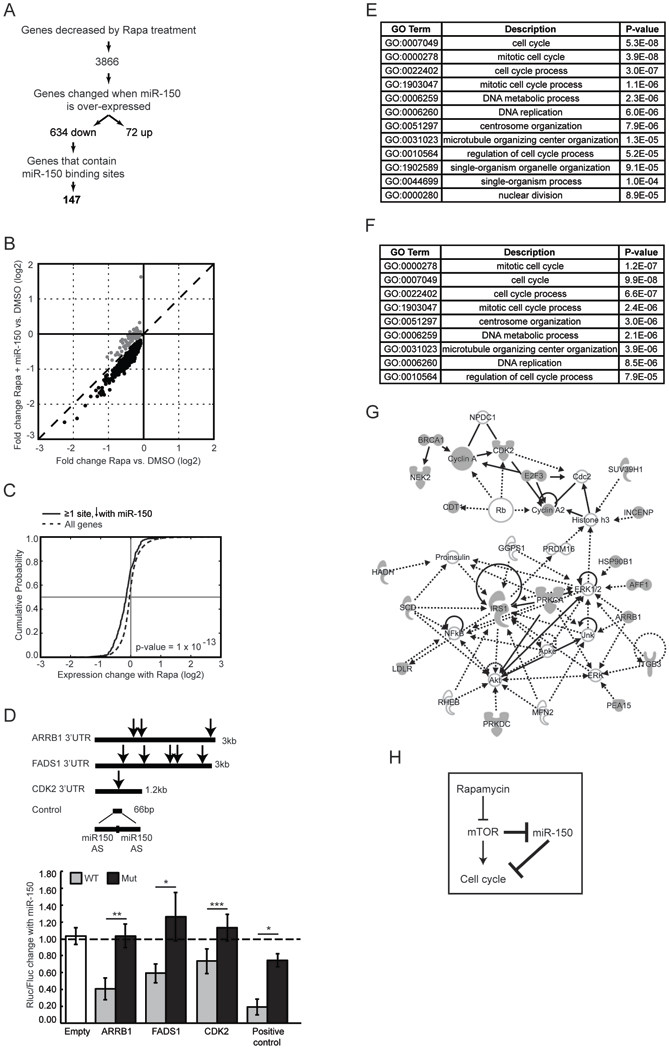
Figure 3. Identification and analysis of genes directly targeted by miR-150.

(A) Experimental flow chart of miR-150 target enrichment. Gene expression was determined in Jurkat cells at three conditions: control miRNA plus DMSO, control miRNA plus rapamycin, and miR-150 plus rapamycin. miRNA targets were predicted using Targetscan (51). Because miR-150 has relatively few predicted targets with a conservation score in the 50th percentile or above, we used low stringency criteria by imposing no conservation or context score cut offs. (B) Ectopic miR-150 expression prior to rapamycin treatment induces further down-regulation of genes that are normally decreased by rapamycin (black circles). Dashed line denotes an identity line. (C) Cumulative distribution function (CDF) plots of gene expression changes induced by rapamycin treatment. Genes that contain at least one miR-150 binding site and that also decreased in response to miR- 150 over-expression are plotted using a solid line; all genes expressed in Jurkat cells are plotted using a dashed line. Vertical line marks no change in expression; horizontal line marks mean expression change. A shift to the left indicates a higher probability of down- regulation in response to rapamycin. P-value was calculated using the Kolmogorov- Smirnov nonparametric test. (D) Luciferase reporter assay for selected miR-150 targets. Renilla luciferase luminescence was measured 24 h after transfection into Jurkat cells and normalized to the signal from firefly luciferase encoded on the same vector. Note, perfect complementarity between the positive control reporter and miR-150 triggers siRNA- mediated silencing. AS - antisense; Empty - reporter without a 3’UTR; Rluc - Renilla luciferase; Fluc - firefly luciferase; arrow - miR-150 site; dashed line - no change between cells transfected with miR-150 and control miRNA; Mut - mutated miR-150 sites. Data are shown as means ±S.D (n = 4) and represent at least 3 independent experiments. * p < 0.05, ** p < 0.005, *** p < 0.0005, n.s. - not significant (Student’s t-test). (E) GO terms enriched within the 147 miR-150 target genes relative to all genes expressed in Jurkat cells and (F) relative to genes differentially expressed in response to rapamycin. All terms with FDR < 0.1 are shown. (G) Network with the highest number of functional connections between the 147 target genes created using Ingenuity Pathway Analysis software. Target genes are shaded in gray; interpolated nodes are not shaded. (H) A model suggested by the present work; novel connections are bolded.
