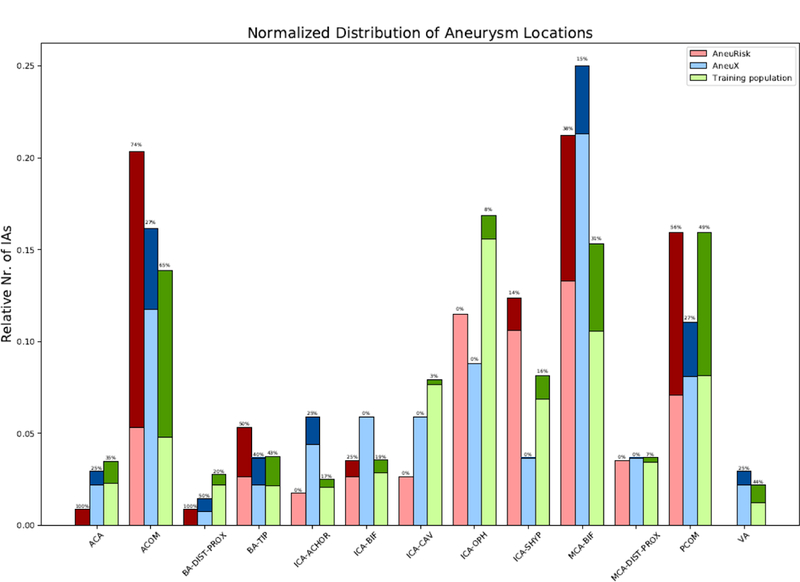
Fig. 1.

Distribution ruptured (dark colors) and unruptured (light colors) aneurysms by location and patient cohort. To facilitate a comparison between the different cohorts, all absolute numbers of aneurysms per location were normalized by the total number of aneurysms of the respective cohort. The shown percentages refer to the rupture rates for each location. For the definition of the aneurysm locations see the description of the model’s parameters in [7]
