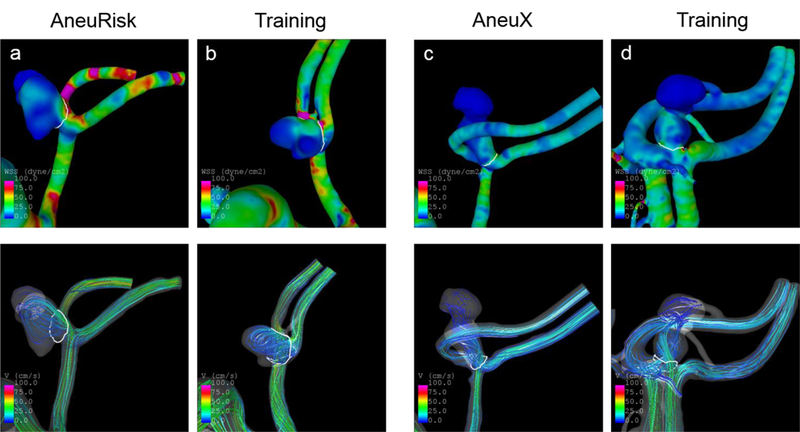
Fig. 4.

Wall shear stress distribution (top panel) and streamlines (bottom) at half of the cardiac cycle of four ruptured IAs with high probabilities of being ruptured based on the model. The shown IAs from training data were identified as similar cases for the respective AneuRisk or AneuX case. The predicted probabilities and values of selected variables for these cases are shown in Tab. 3
