
Fig. 5.
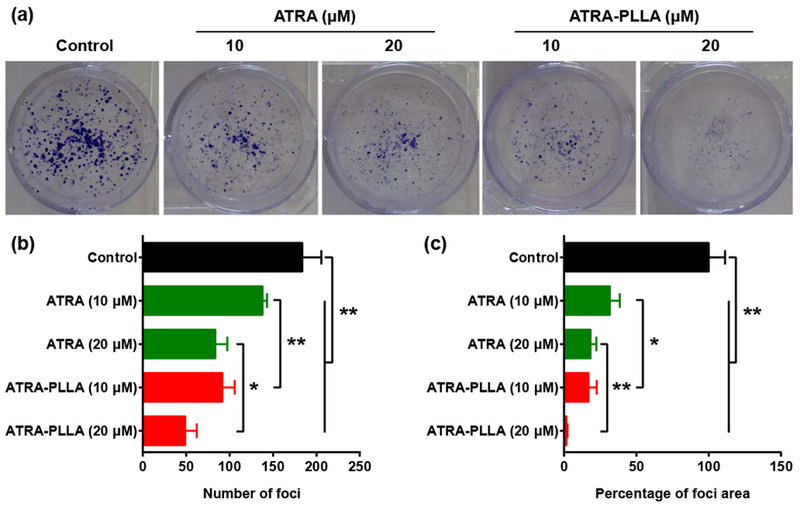
(a) Image, (b) number, and (c) area of foci formed by HuH7 cells treated with the indicated concentration of free ATRA or ATRA-PLLA particles for 72 h. Untreated cells were used as control. Each value is the mean ± standard deviation of triplicate determinations; *p < 0.05, **p < 0.01.