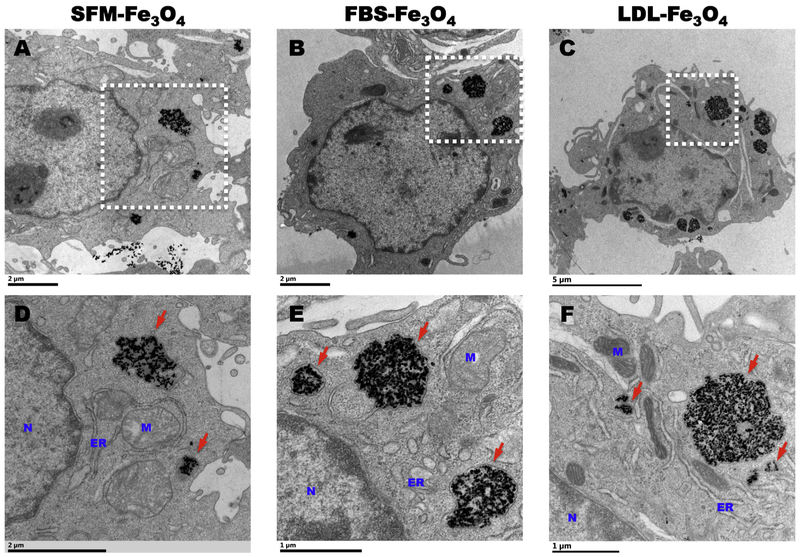
Fig. 2.
Internalization of Fe3O4 NPs in macrophages. (A), (B), and (C) are representative TEM images of internalized Fe3O4 NPs incubated in SFM, 10% FBS, 10% FBS + 200 mg/dL LDL in macrophages, respectively. Scale bar: 2 μm (A), 2 μm (B), and 5 μm (C). (D), (E), and (F) are representative high-resolution TEM images of internalized Fe3O4 NPs incubated in SFM, 10% FBS, 10% FBS + 200 mg/dL LDL in macrophages, respectively. N: nuclear; M: mitochondria; ER: endoplasmic reticulum. Red arrows point at the internalized Fe3O4 NPs as electron-dense NPs that are encapsulated by membrane as endosome-like vesicles. Scale bar: 2 μm (D), 1 μm (E), and 1 μm (F). (For interpretation of the references to colour in this figure legend, the reader is referred to the web version of this article.)

