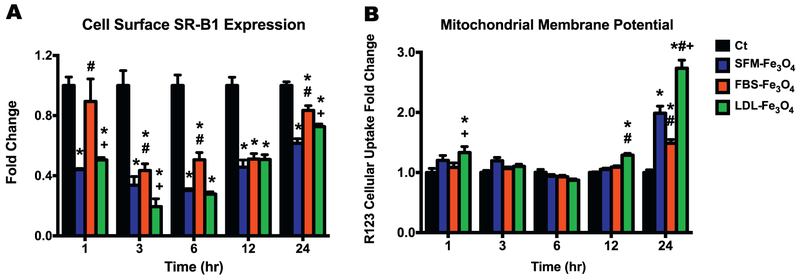
Fig. 4.
Cell surface expression of SR-B1 and MMP in macrophages with or without Fe3O4 NPs exposure. (A) Cell surface expression of SR-B1 (fold change compared to the control) in macrophages with or without Fe3O4 NPs exposure using fluorescent immunocytochemistry staining and flow cytometry analysis. (B) Intracellular Rhodamine 123 (R123) accumulation (fold change compared to the control) in macrophages with or without Fe3O4 NPs exposure. Data represent mean + SEM, n = 6/group. *p < 0.05, as compared with the control group; #p < 0.05, as compared with the SFM-Fe3O4 NPs group; +p < 0.05, as compared with the FBS-Fe3O4 NPs group.

