
FIG 5.
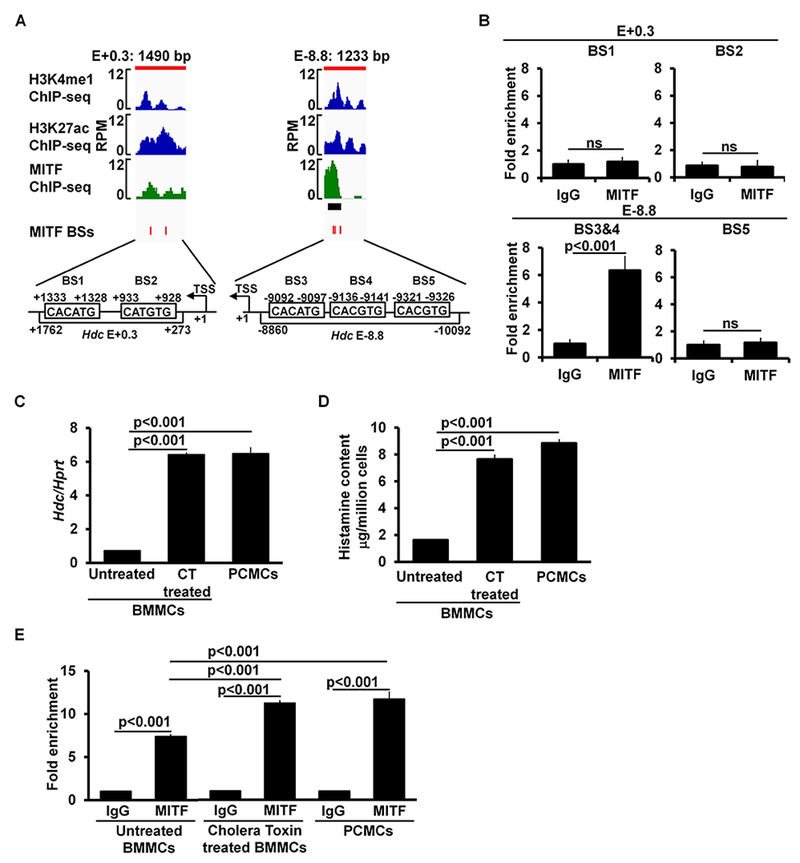
MITF binds to the −8.8 enhancer in immature and mature mast cells. A, Enlarged ChIP-seq peak plots of the Hdc E-8.8 region and Hdc E+0.3. The published MITF ChIP-seq data were aligned with our H3K4me1 and H3K27ac ChIP data using the Integrative Genomics Viewer. The black bar beneath the MITF ChIP-seq peak plot indicates the MITF-binding peak that is statistically significant. The red bars indicate the positions of consensus MITF-binding sites (BSs). B, ChIP-qPCR analysis of MITF binding (mean ± SEM, n=2 samples from 2 independent experiments). BMMCs, anti-MITF antibody or control IgG was used for immunoprecipitation. C, qPCR analysis of the Hdc mRNA expression (mean ± SEM, n=3 samples from 3 individual mice); D, ELISA analysis of histamine content (mean ± SEM, n=3 samples from 3 individual mice); and E, ChIP-qPCR analysis of MITF binding in untreated BMMCs, cholera toxin treated BMMCs, and PCMCs (mean ± SEM, n=3 samples from 3 independent experiments). CT: Cholera Toxin.