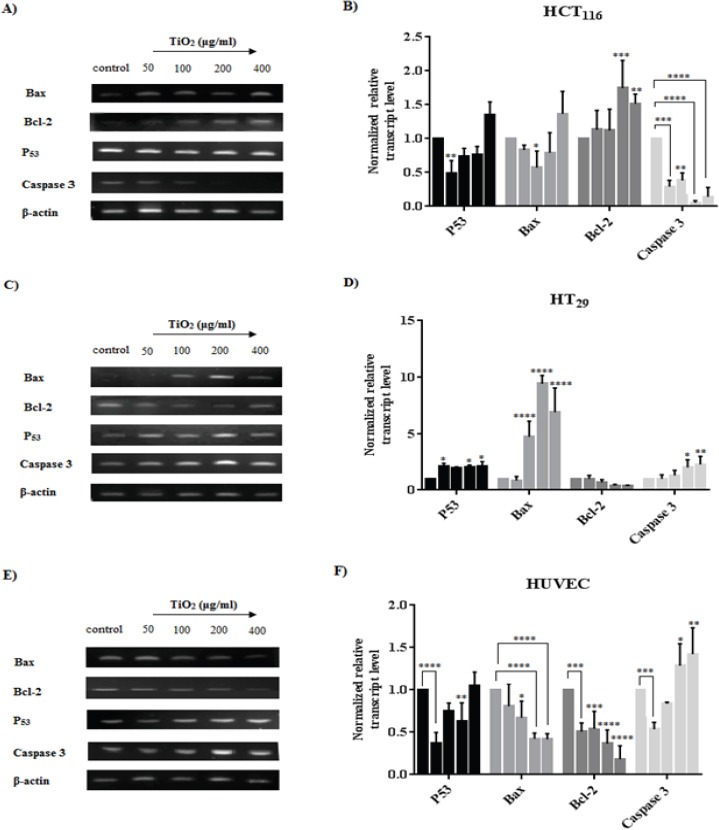
Figure 7.

RT-PCR Analysis of the Expression Changes in mRNA Level of P53, Bax, Bcl-2, Caspase 3 after Exposure to TiO2 NPs for HCT116 (A and B), HT29 (C and D) and HUVECs (E and F). A, C and E show the effect of TiO2 NPs on mRNA expression and B, D and F represent an analysis of the fluorescent intensity of each band which is normalized fold change mRNA expression. β-actin was used as housekeeping and control for loading respectively. Band density of the specific gene expression was analyzed with Image J and the results were normalized to β-actin. Graphs represent the normalized grade of fluorescent to assess the gene expression level of the cell lines. Bars represent the mean ± SD of three independent experiments. *P<0.05, **P<0.01, ***P<0.001, ****P<0.0001 vs control.
