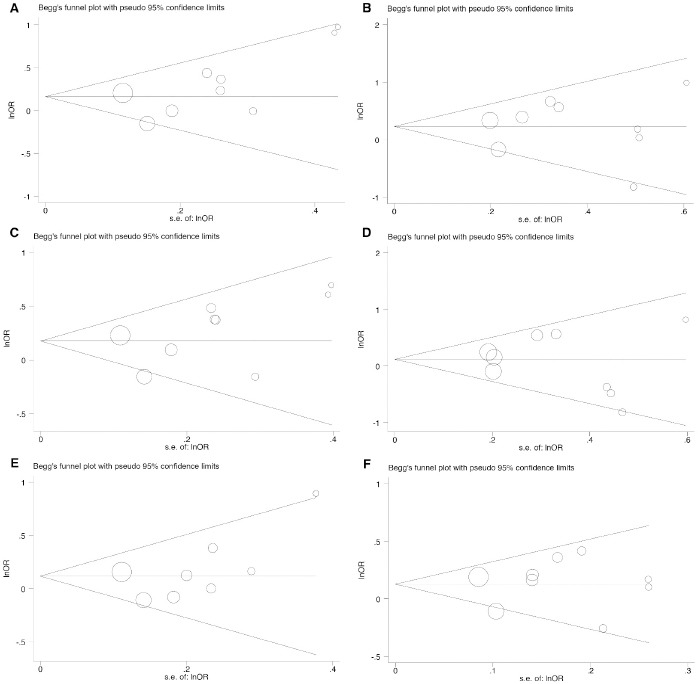
Figure 2.

Begg’s Funnel Plot for Publication Bias Test for RETN rs1862513 Polymorphism. Each point represents a separate study for the indicated association. (A), heterozygous model; (B), codominant homozygous model; (C), dominant model; (D), reccesive model; (E), ovedominanat model; (F), allelic model.
