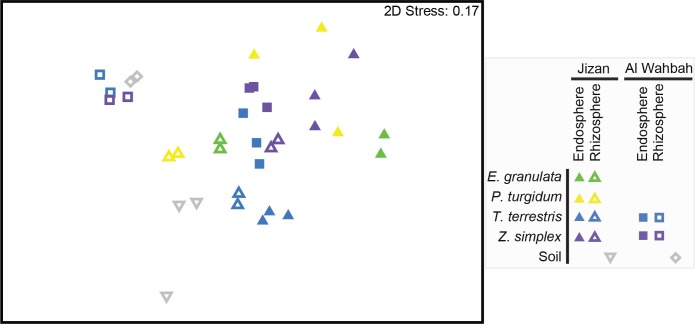
Fig 2. Non-metric multidimensional scaling (nMDS) of bacterial communities from the soil, rhizosphere and root endosphere of four pioneer desert plants in Jizan and Al Wahbah.
The plot is based on Bray Curtis distances of square root transformed abundance data of bacterial OTUs (for OTUs > 9 reads). The stress value denotes the goodness of fit. Plant species and soil samples are indicated by colors: green (E. granulata), yellow (P. turgidum), blue (T. terrestris), purple (Z. simplex), grey (soil); sample locations are indicated by shapes: triangles (Jizan), squares (Al Wahbah); sample types are indicated as: filled symbols (endosphere), hollow symbols (rhizosphere).

